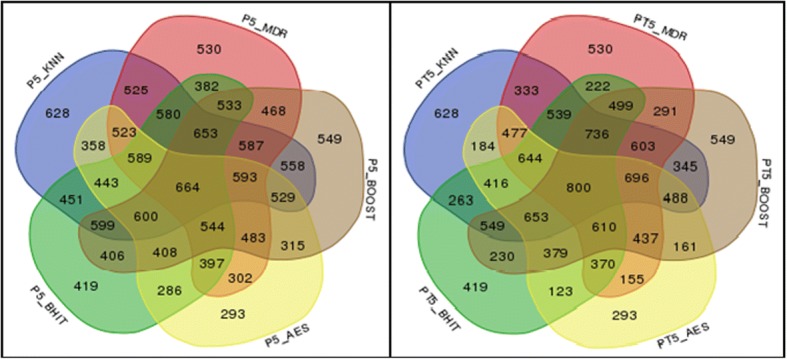
Fig. 5.

Power (in ‰) of 5 individual methods (KNN, MDR, BOOST, AntEpiSeeker, BHIT) and of the 26 possible combinations of aggregated methods. The left diagram shows the results obtained in the simulations, while the right diagram shows the expected results under the hypothesis of methods independence. Note that the latter does not necessarily correspond to a majority vote
