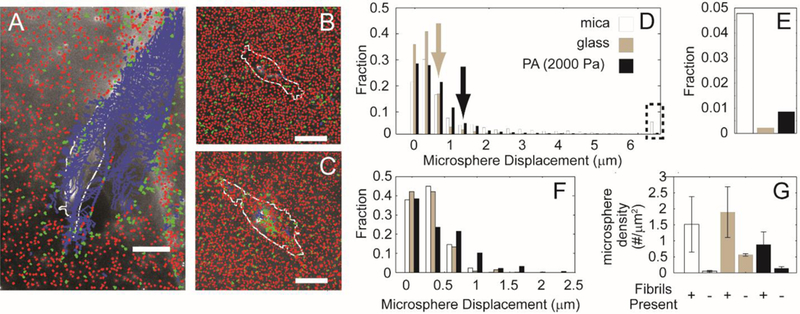
Figure 5: Trajectories of fluorescent microspheres adsorbed on aligned collagen fibrils.

Collagen fibrils (A) assembled on mica substrates, (B) transferred to glass substrates or (C) transferred to 2000 Pa PA substrates and labeled with the fluorescent microspheres. Microsphere trajectories are colored differently depending on their average displacement. Blue indicates mean displacements larger than 2 μm, green indicates average displacements between 600 nm and 2 μm and red indicates average displacements smaller than 600 nm. The cell outline from one time point is shown in white. (D) Fraction of microsphere displacements when the distances between the cell edge and the microsphere is very small (0–10 μm). Arrows indicate the microsphere at which the transferred substrate crosses the mica substrate (E) Fraction of large displacements (> 6 μm). (F) Fraction of microsphere displacements when the distances between the cell edge and the microsphere is very large (180–190 μm). (G) Microsphere number per μm2 on different substrates with and without fibrils. Calibration bar length is 30 μm.
