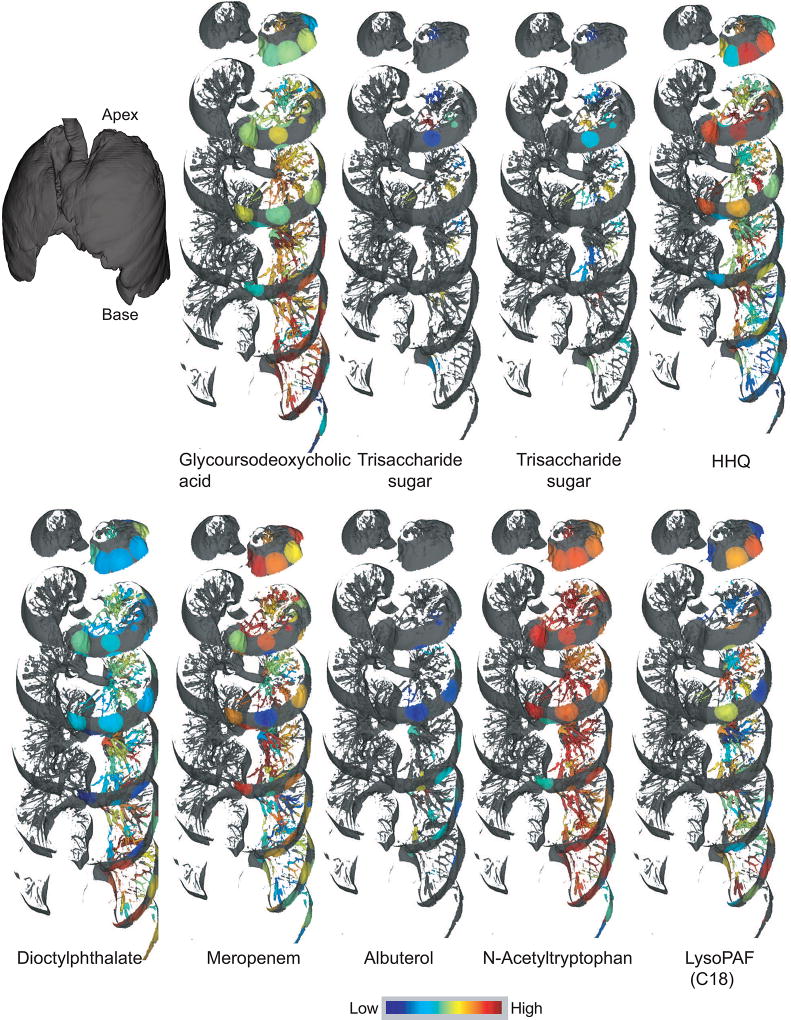
Figure 4.
Distributions of selected features identified using molecular networking. The distribution is shown on a jet color scheme where red represents the highest abundance and blue represents the lowest abundance. The mapping has been performed on the left lung. The interactive visualization is available at the weblinks: Glycurodeoxycholic acid (6-fold difference), Trisaccharide sugar 1 (5-fold difference), Trisaccharade sugar 2 (4-fold difference), HHQ (64-fold difference), Dioctylphthalate (5-fold difference), Meropenem (27-fold difference) , Albuterol (4-fold difference), N-Acetyltryptophan (14-fold difference), and LysoPAF (3-fold difference). The navigable atlas for all detected molecules is available at weblink: (Molecule_maps).

