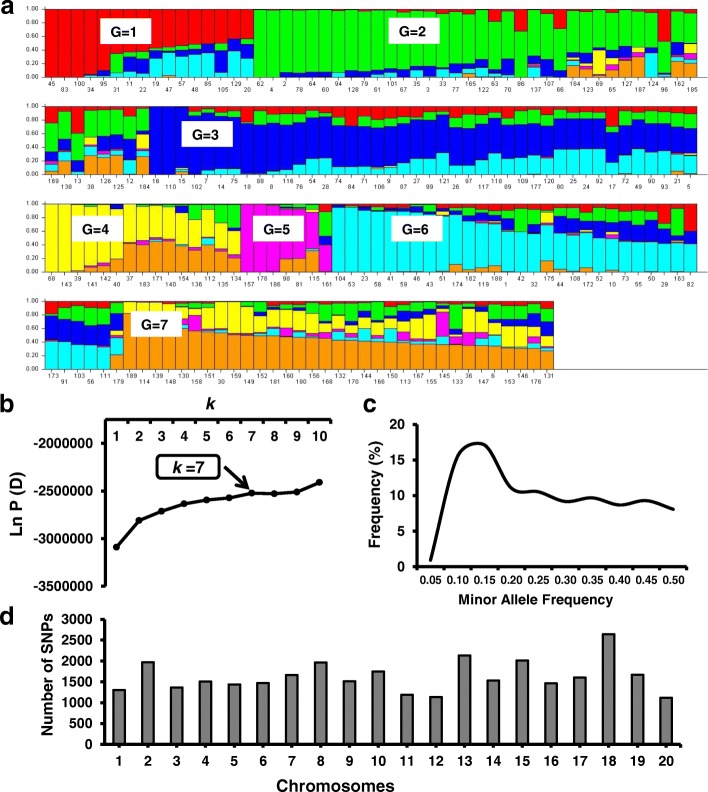
Fig. 3.
Population structure results using 32,453 SNPs across 189 soybean genotypes. a Model-based clustering method STRUCTURE showing individual genotypes in the population structure of 189 soybean genotypes (k = 7) based on 32,453 single nucleotide polymorphisms. The y-axis is the subpopulation membership, and the x-axis is the individual genotypes in each subpopulation. G, subpopulation (G1–G7). b Log probability data LnP(D) as function of k (number of groups) from the structure run. The plateau of the graph at k = 7 indicates the minimum number of subgroups possible in the panel. c Minor Allele Frequency percentage distribution of 32,453 SNPs. d Distribution of 32,453 SNPs obtained from 189 soybean genotypes across 20 soybean chromosomes

