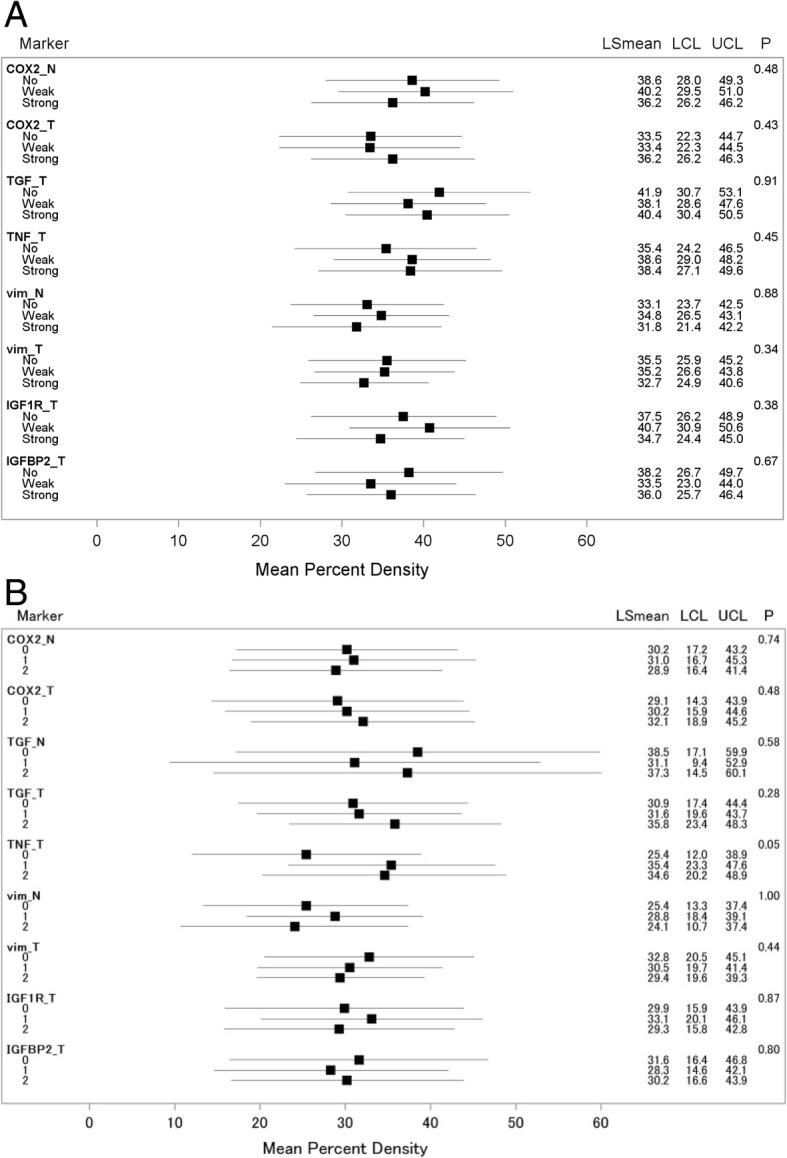
Fig. 2.

Mean mammographic density with 95% confidence intervals for each level of marker expression (no, weak, strong)a (a) all women and (b) postmenopausal women. (aMeans of percent density for the three categories of marker expression (no, weak, strong) were calculated by linear regression after having controlled for all covariates, i.e., holding them constant at their mean values. The P-values evaluate the significance of the trend tests. Abbreviations: N and T after the marker names indicate normal vs. tumor tissue, vim vimentin)
