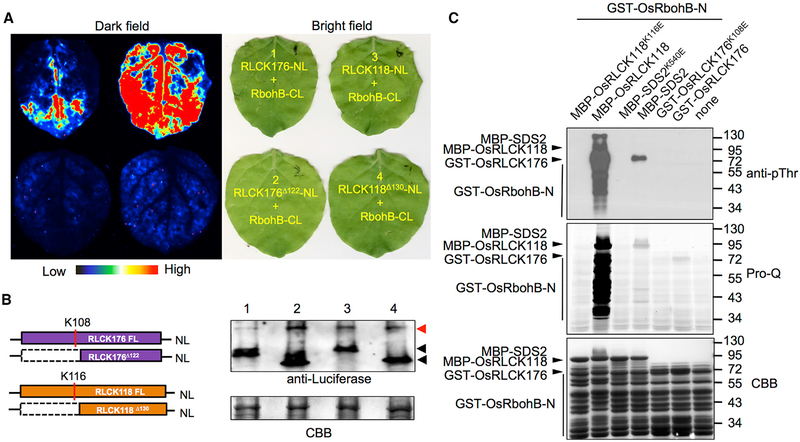
Figure 7. OsRLCK118 Interacts with and Phosphorylates the NADPH Oxidase OsRbohB.
(A) Luciferase complementation imaging (LCI) analysis of the OsRLCK118/176-OsRbohB interactions in N. benthamiana. OsRLCK118/176 and OsRbohB were fused to the N terminus (NL) and C terminus (CL) of luciferase, respectively. Co-infiltrated leaves were treated with 1 mM luciferin and applied to fluoresce imaging 3 days after infiltration. Light spectrum bar indicates signal intensity.
(B) Protein levels of OsRLCK118/176 and OsRbohB in LCI analysis are determined by western blot. CBB staining is used to show loading amount. Red and black arrows indicate OsRbohB-CL and OsRLCK118/OsRLCK176-NL, respectively.
(C) Phosphorylation of OsRbohB by OsRLCK118 in vitro. GST-OsRbohB-N was used as the substrate to detect phosphorylation by OsRLCK118/176 and SDS2. GST-OsRbohB-N phosphorylation was visualized by immunoblotting (anti-pThr) and Pro-Q staining. CBB staining shows loading amounts. “None” (lane 7) indicates no kinase was added. See also Figure S7.

