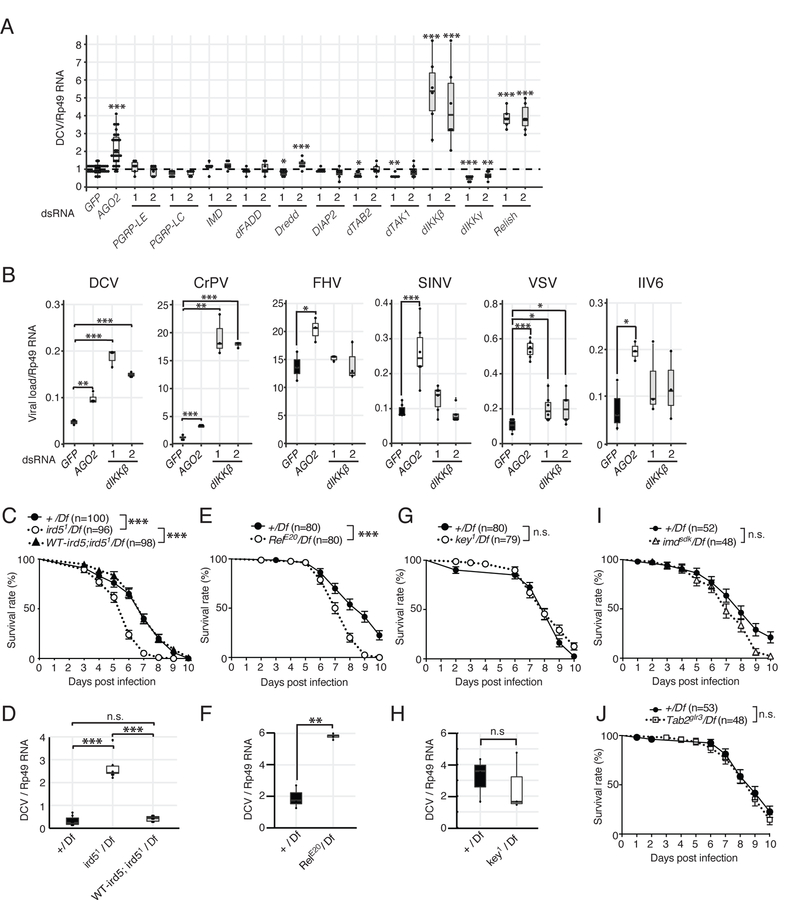
Figure 1. dIKKβ and Relish, but not the regulatory subunit dIKKγ, participate in resistance to DCV infection.
(A) S2 cells were treated with dsRNAs for each major component of the IMD pathway, infected with DCV and its replication was monitored by RT-qPCR. Two different regions of each gene designated as (1) and (2) were targeted by dsRNAs to detect possible off-target effects. GFP and AGO2 were used as negative or positive controls, respectively.
(B) S2 cells were treated with control or dIKKβ targetting dsRNAs, infected with the indicated viruses, and viral load was monitored by RT-qPCR 16h (DCV, CrPV, FHV) or 48h (VSV, SINV, IIV6) later.
(C and D) Control (+/Df), dIKKβ null mutant (ird51/Df) and genomic rescue (WT-ird5;ird51/Df) flies were infected with DCV and survival rates (C) and viral RNA loads (D) were monitored.
(E–J) Similar analyses were performed on null mutant flies for Relish (RelE20/Df) (E and F), dIKKγ (key1/Df) (G and H), imd (imdsdk/Df) (I) and TAB2 (Tab2glr3/Df) (J). (A and B) Data are representative from 3–5 independent experiments, each containing at least 3 biological replicates, except for IIV6 and SINV (n=2). (C-J) Mean of at least three independent experiments is shown. For survival curves, the numbers of flies is indicated and log-rank (Mantel Cox) test was used. (D,F and H) Mean of 3 independent experiments, each involving at least two biological replicates. Boxplots represent the median (horizontal line) and 1st/3rd quartiles, with whiskers extending to points within 1.5 times the interquartile range. Student t-test, p*<0.05. p**<0.01. p***<0.001. n.s. indicates statistically non significant. See also Figure S1.

