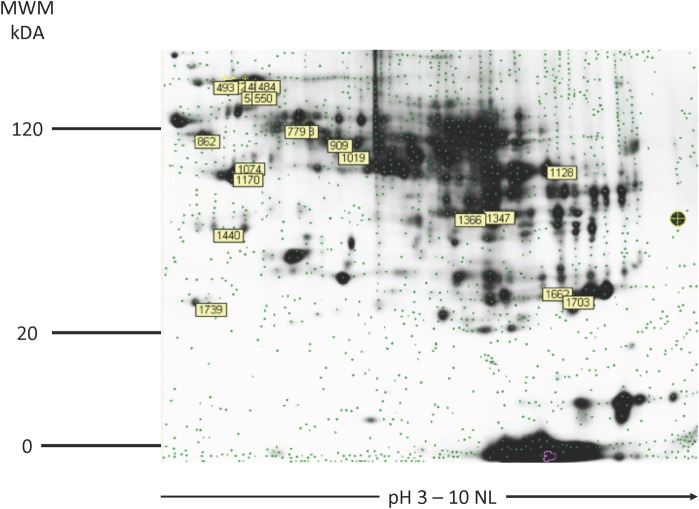
Fig 1. 2-D gel image of the master gel with labeled picked proteins spots.
Proteome pattern of canine liver tissue by means of 2D –DIGE. For protein analysis, proteins were labeled with Cy2, Cy3, and Cy5, separated in the first dimension using an immobilized pH gradient, and subsequently, in the second dimension, by sodium dodecyl sulfate polyacrylamide gel electrophoresis. Protein spots were detected using a fluorescence scanner (MWM–molecular weight marker; kDA–kilodalton, NL–nonlinear).

