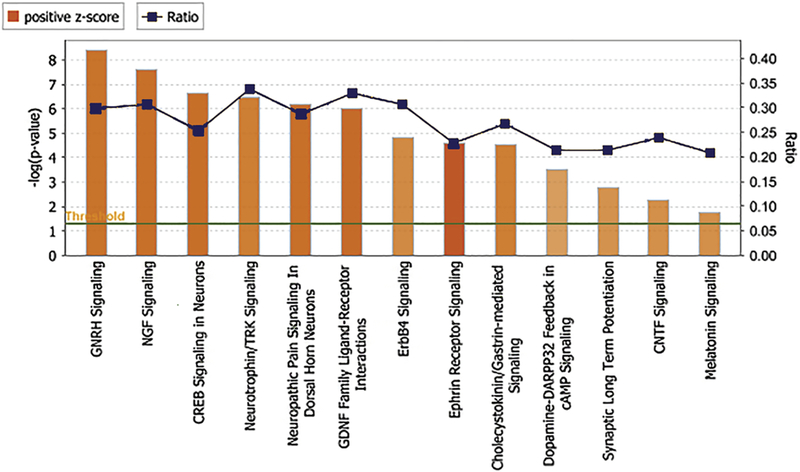
Figure 2. The canonical pathways associated with nervous system signaling that are significantly upregulated by CEPO.

The canonical pathways are represented on the x axis. The y axis represents the significance scores as -log p-value. The threshold line in dark green indicates the significance (p<0.05) cutoff The height of the bar shows the level of significance. The ratio number line in dark blue represents number of molecules present in the dataset divided by the total number of molecules in the pathway.
