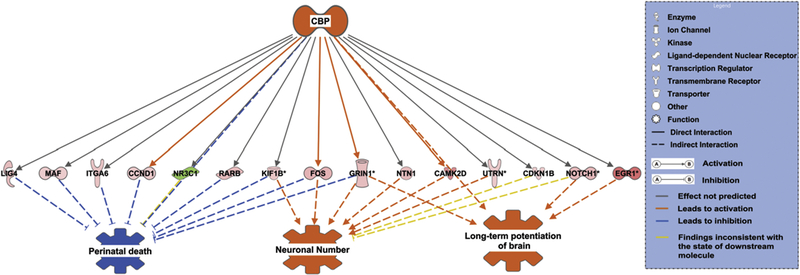
Figure 5. CBP regulation of different neuronal functions through its interaction with differentially expressed genes.

Red and green nodes represent the differentially expressed genes. A red node denotes an up-regulated gene, and a green node denotes a down-regulated gene. The intensity of the node color indicates the degree of up or down regulation. Different structures of the nodes represent different functional class of the gene product. Edges represent the type of relationship between the nodes. Filled arrow head indicates activation and bar-headed line indicates inhibition. Orange line indicates that it leads to activation, blue line indicates that it leads to inhibition, grey line indicates that the effect is not predicted and yellow line that the findings are inconsistent with the state of the downstream molecule.
