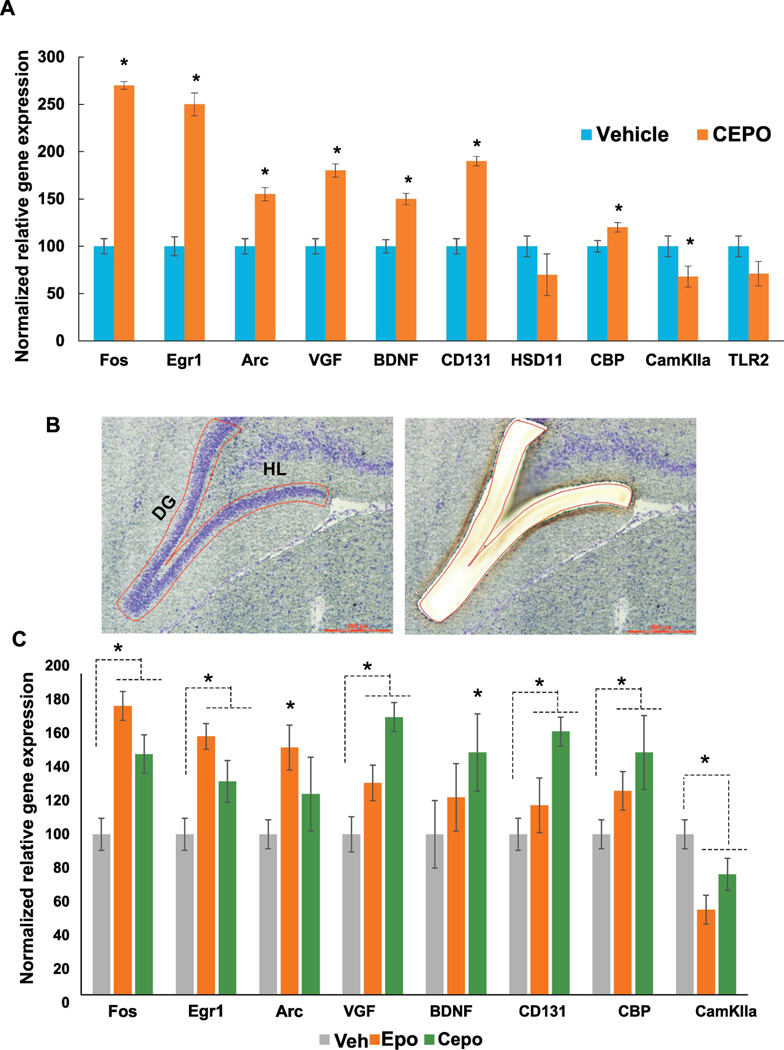
Figure 6. Independent secondary validation of microarray data and Comparative analysis of EPO and CEPO-induced gene regulation in the hippocampus.

A. Quantitative PCR analysis was performed using gene specific primers. Gene regulation is expressed as percentage of vehicle levels (N=6). Error bars are +/− SEM; *p < 0.05 vs Vehicle, t-test. B. Laser microdissection of the dentate gyrus showing before (left) and after (right) images of the same section. C. Quantitative PCR analysis of EPO and CEPO-induced gene regulation in the dentate gyrus. Gene regulation is expressed as percentage of vehicle levels. Error bars are +/− SEM; *p < 0.05 ANOVA. Egr1- early growth response 1, Arc - activity regulated cytoskeleton-associated protein, VGF- non-acronymic, BDNF- brain derived neurotrophic factor, CD131 - beta common receptor, HSD11- l1β hydroxysteroid dehydrogenase, CBP- CREB binding protein, CamKIIa- calcium/calmodulin dependent protein kinase type 2 alpha, TLR2- toll-like receptor 2. DG - dentate gyrus, HL- hilus.
