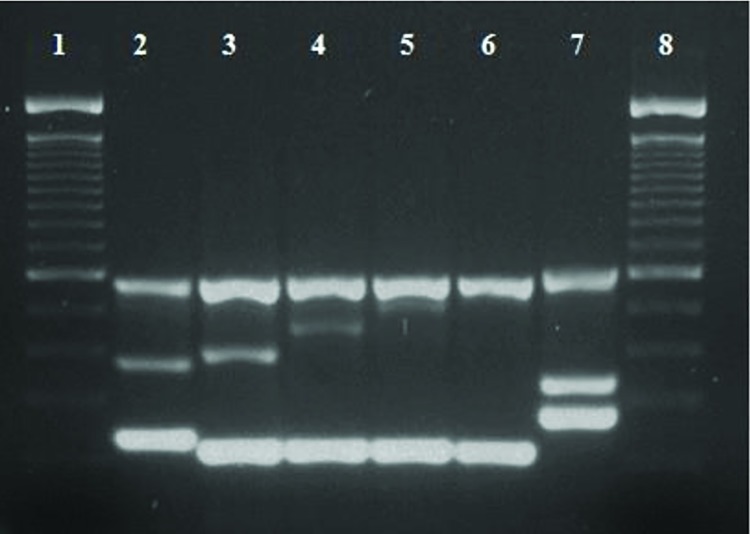
Fig 3. Agarose gel analysis of the all five types of VNTR profiles from representative S. Typhi local isolates.
Lane 1 and 8:100bp DNA ladder (Invitrogen 15628–019; showing bands of 2072, 1500, 1400, 1300, 1200, 1100, 1000, 900, 800, 700, 600, 500, 400, 300, 200 and 100 bp), Lane 2–6: Vi-positive S. Typhi isolates, Lane 7: Vi- negative S. Typhi isolates.

