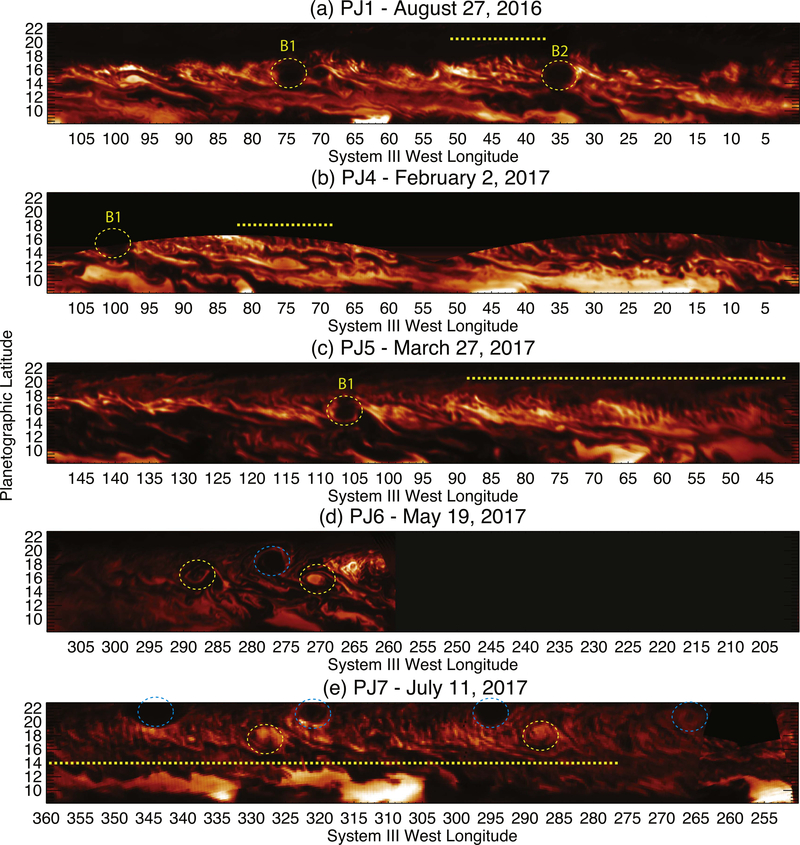
Figure 5.
Cylindrical projections of Juno JIRAM 5-μm data from PJ1 to PJ7 (excluding PJ2–3 when JIRAM was not on). Prominent cyclones are indicated by yellow ovals (B1 and B2 are labeled), and prominent anticyclones are indicated by blue ovals. The longitude range of potential mesoscale wave activity is shown by the yellow dotted line and is most clear during PJ5 (2017 March) and PJ7 (2017 July) data.

