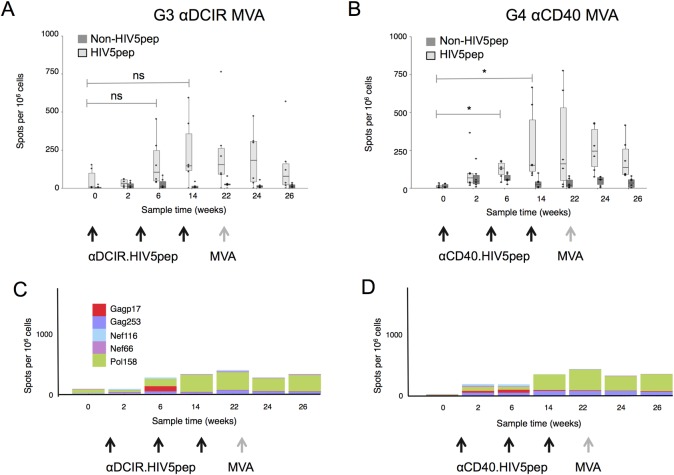
Fig 3. T cell responses to αDCIR.HIV5pep and αCD40.HIV5pep vaccines in naïve Rhesus macaques.
PBMCs were harvested at the indicated time points and analyzed by IFNγ ELISPOT using pools of overlapping Gag Pol and Nef peptides corresponding to sequences carried by the DC-targeting vector (HIV5 peptides, shown in light grey), or pools of overlapping Gag Pol and Nef peptides corresponding to sequences not carried by the DC-targeting vaccines but carried by MVA GagPolNef (non-HIV5 pep, shown in dark grey). (A) IFNγ ELISPOT data from animals vaccinated with three administrations of 250 μg αDCIR.HIV5pep (G3) or (B) αCD40.HIV5pep (G4) plus 1 mg poly-ICLC followed by a boost with MVA GagPolNef. Responses from individual animals in the indicated groups are shown as points and were summed for these two pool sets. The mid-line of the box denotes the median, and the ends of the box denote the 25th and 75th percentiles. The whiskers are the minimum/maximum value higher/lower than 1.5* Inter-Quartile Interval. Values after the second and third αDCIR.HIV5pep vaccinations at week 0 compared to weeks 6 or 14 were not significantly different (G3; ns; respectively, p = 0.03, p = 0.1). Values after the second and third αCD40.HIV5pep vaccinations at week 0 compared to weeks 6 or 14 were not significantly different (G4; *; respectively, p = 0.15, p = 0.03). (C) and (D) IFNγ ELISPOT data for individual Gag, Pol and Nef peptides stimulations as described above. The X-axis shows sampling time in weeks. S6 Table and S3 Table and S1 File show data corresponding to this figure.

