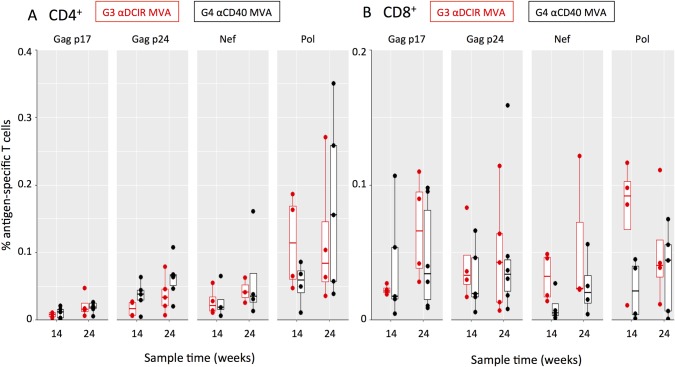
Fig 5. Analysis of HIV-1 epitope-specific CD4+ and CD8+ T cell responses elicited in naïve NHPs by αDCIR.HIV5pep and αCD40.HIV5pep vaccines.
Intracellular cytokine staining analysis of HIV-1 antigen-specific CD154+ CD4+ and CD8+ T cells elicited by αDCIR.HIV5pep and αCD40.HIV5pep vaccines. PBMCs were collected from individual animals at week 14 (two weeks post DC-targeting vaccines) and week 24 (two weeks post MVA boost) for G3 αDCIR MVA and G4 αCD40 MVA. PBMC were stimulated in the presence of Brefeldin A for 6 h with pools of HIV-1 peptides corresponding to the indicated gene regions and analyzed by flow cytometry. Each dot is the background-subtracted value for individual animals of (A) CD154+ CD4+ and (B) CD8+ T cells secreting IFNγ, TNFα, IL-2, or combinations thereof when stimulated with Gag p17, Gag p24, Nef and Pol peptides. Negative background subtracted values were set to zero. Responses from individual animals in the indicated groups are presented. The mid-line of the box denotes the median, and the ends of the box denote the 25th and 75th percentiles. The whiskers are the minimum/maximum value higher/lower than 1.5* Inter-Quartile Interval. S4 Table shows the data corresponding to this figure.

