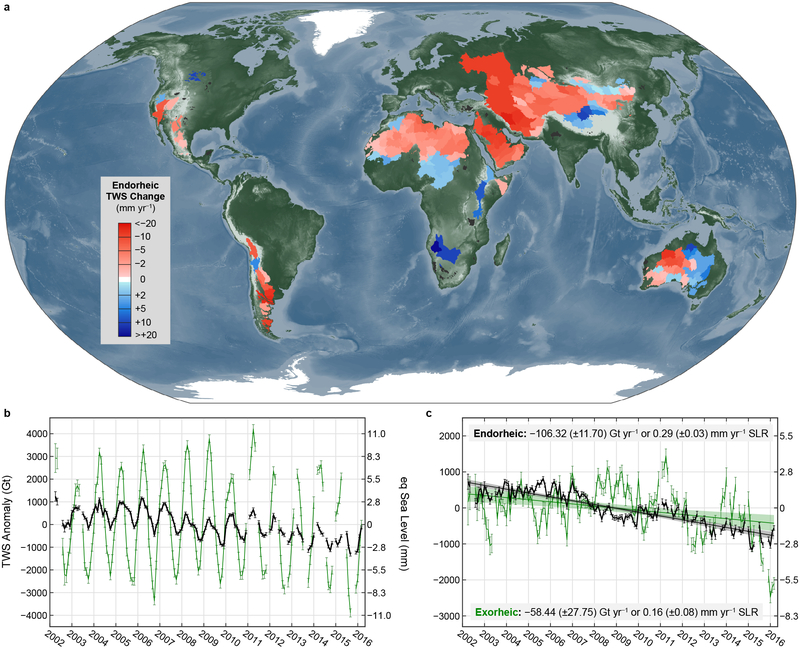
Figure 1.
Terrestrial water storage (TWS) changes within global endorheic and exorheic basins from GRACE observations, April 2002 to March 2016. (a) Trends in individual endorheic units, each comparable to the 3-degree mascon in size (~100k km2). No trends are calculated for sporadic endorheic regions (black) smaller than a mascon. (b) Monthly anomalies in endorheic (black) and exorheic (green) regions. (c) Deseasonalized anomalies (axes as in b). Error bars show 95% confidence intervals (CIs) of monthly anomalies induced by mascon data errors. Shadings illustrate 95% CIs for best-fit linear trends induced by both mascon and rescaling errors (see Methods for uncertainty analysis).

