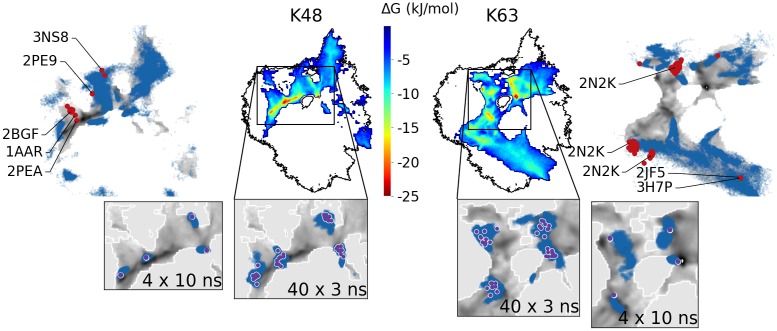
Fig 3. Comparison of atomistic and CG simulations.
Colored heatmaps in center: CG energy landscapes of K48- and K63-linked diUb (as in Fig 2). Outer panels: CG data in gray scale with data from atomistic simulations from open initial conformations superimposed as blue dots. Red points: experimental PDB structures. Bottom insets: Zoom with data from atomistic simulations started from back-mapped CG structures as blue dots (violet points: initial structures).

