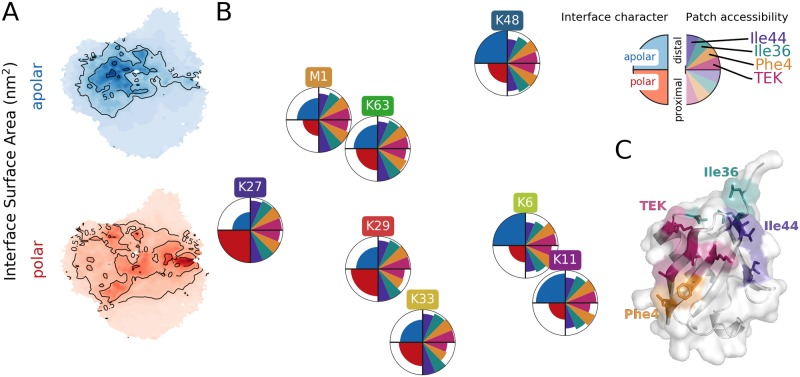
Fig 5. Characteristics of contact interface between Ub subunits from CG simulations.
(A) Mean interface surface area between distal and proximal chain on sketch-map projection divided in polar and apolar parts. (B) Circles positioned as in Fig 4C. Left half of circles show interface character, e.g. K27 has the most polar, K6 and K48 the most apolar interface. Right half of circles shows the accessibility of four known interaction patches on the distal and proximal chain. (C) Interaction patches of Ub.

