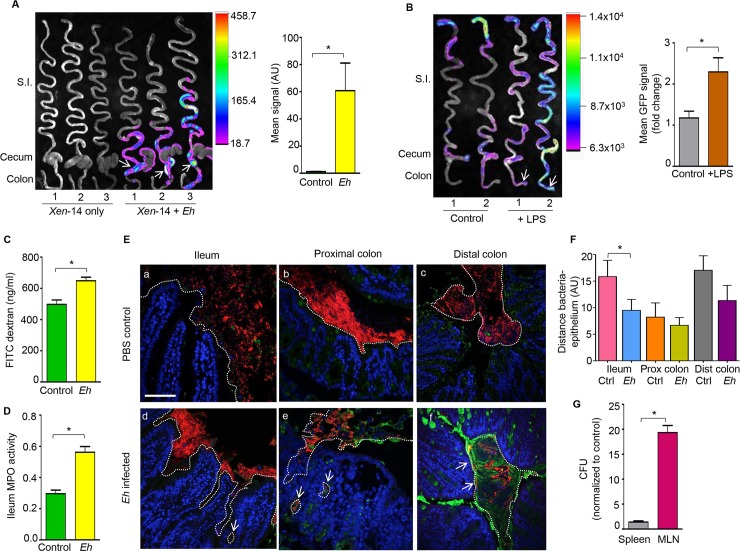
Fig 6. E. histolytica promotes bacterial translocation.
(A) Representative heat map image of the small intestine, cecum and colon of wild type mice inoculated with bioluminescent E. coli XEN 14 and infected with Eh in colonic loops (arrows). The mean bioluminescent signal was quantified and plotted on a histogram. (B) Representative heatmap of Math1 expression in the gastrointestinal tract of Math1GFP mice inoculated with a sub lethal dose of LPS (5mg/kg BW) showing increase Math1 GFP activity in the cecum and distal colon (arrows). Mean GFP signal was quantified and plotted on a histogram. (C) In colonic loops inoculated with Eh, intestinal permeability was measured by serum concentration of FITC-dextran (ng/mL) and (D) myeloperoxidase activity in the ileum (absorbance 450nm). (E) Visualization of bacterial localization by florescence in situ hybridization (FISH) in the ileum (a, d), proximal colon (b, e), and distal colon (c, f) of Eh inoculated loops (d, e, f) and PBS inoculated control loops (a, b, c). Translocated bacteria in response to Eh in the ileum, proximal colon and distal colon are show by the arrows. Red: bacteria, blue: enterocytes nuclei, green: mucus. The dotted line delimits area where commensal bacteria were present. Scale bar = 50 μm. (F) Quantification of the distance between bacteria and the epithelium from images in E was analyzed using ImageJ software. (G) Quantification of colony forming units (CFU) per gram present in the spleen and mesenteric lymph nodes (MLN) following Eh inoculation in colonic loops. GFP: green fluorescent protein, AU: arbitrary units, Ctrl: control, MPO: myeloperoxidase. n = 6, *P < 0.05.

