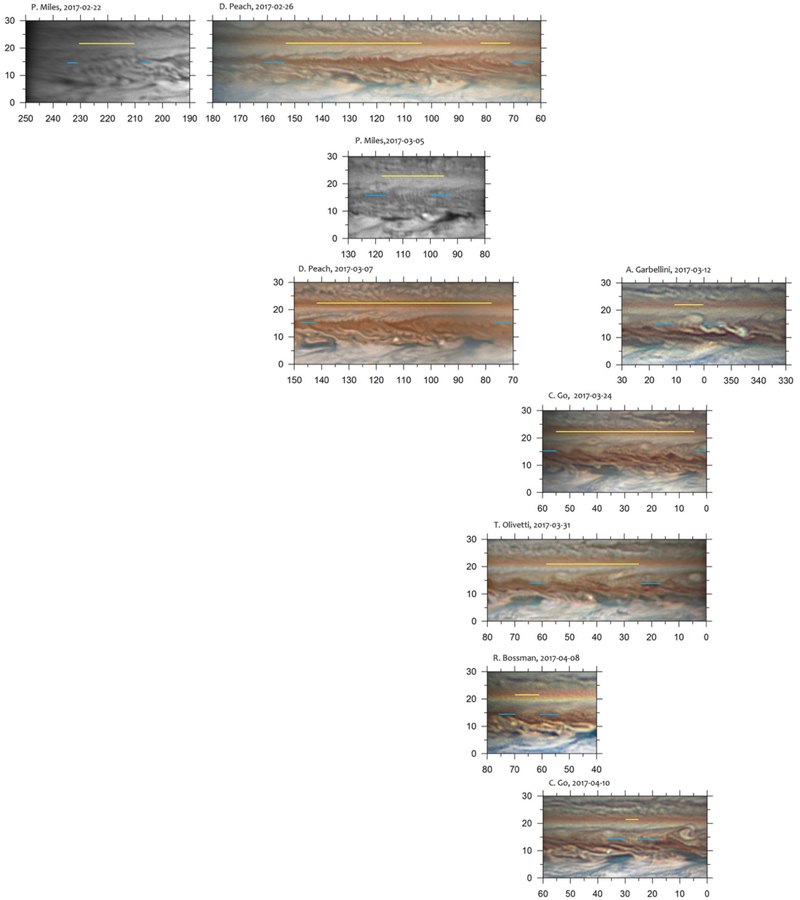
Figure A2.
Cylindrical maps of the NEB based on images listed in Table 2. Blue lines show the start and end of the regions where waves are visible. The different wave systems are highlighted with a yellow line above the latitude of interest. All longitudes are given in System III and all latitudes are planetocentric.
Dates are from 22 February to 10 April.

