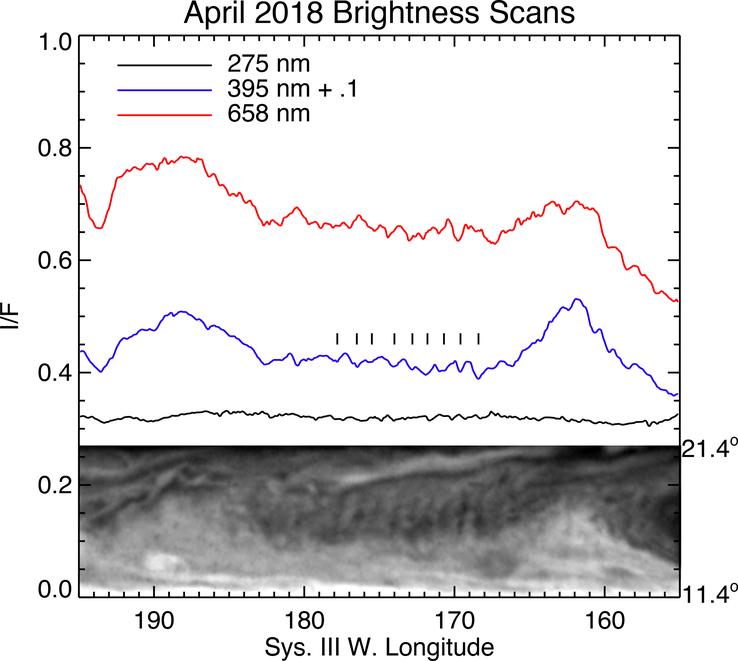
Figure 4.
Brightness scans at 16.4° +/− 0.1° in HST images from 17 April 2018. White anticyclonic regions are seen near 162° W and 188° W in the image at 395 nm. Wave crests appear as periodic brightness variations above the background clouds; the 395-nm curve is shifted by 0.1 for clarity. Maximum contrast of the wave crests above the background features is ~3%, ~10% and ~6% at 275, 395 and 658 nm, respectively.

