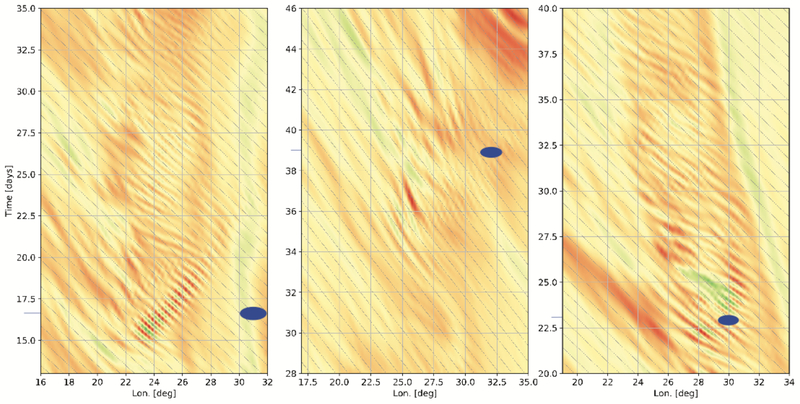
Figure 7.
Temporal evolution of the potential vorticity at 17° latitude for cases #1 (left), #2 (middle) and #3 (right). These Hovmoller diagrams highlight the difference from the mean flow, and the location of the vortices and day of simulation in Fig. 6 are marked in blue. The gray diagonal lines are spaced by 1°, and their slope corresponds to a velocity of ~17.5 m/s.

