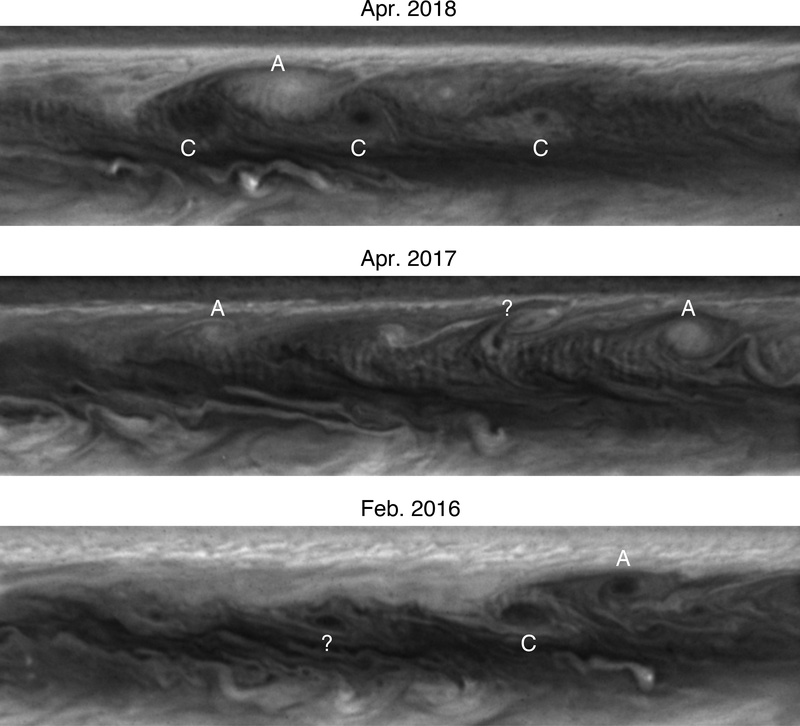
Figure 8.
HST maps from April 2018, April 2017 and Feb. 2016 spanning 80° of longitude and 20° of latitude. These three dates roughly match the three cases shown in Figs. 6 and 7. Note that extensive wave trains are seen in Apr. 2018 among cyclones (C) and anticyclones (A). The Apr. 2017 map segment mainly shows anticyclones and features suggestive of a vortex (denoted by ?). In Feb. 2016, only a small wave train is seen over a single cyclone.

