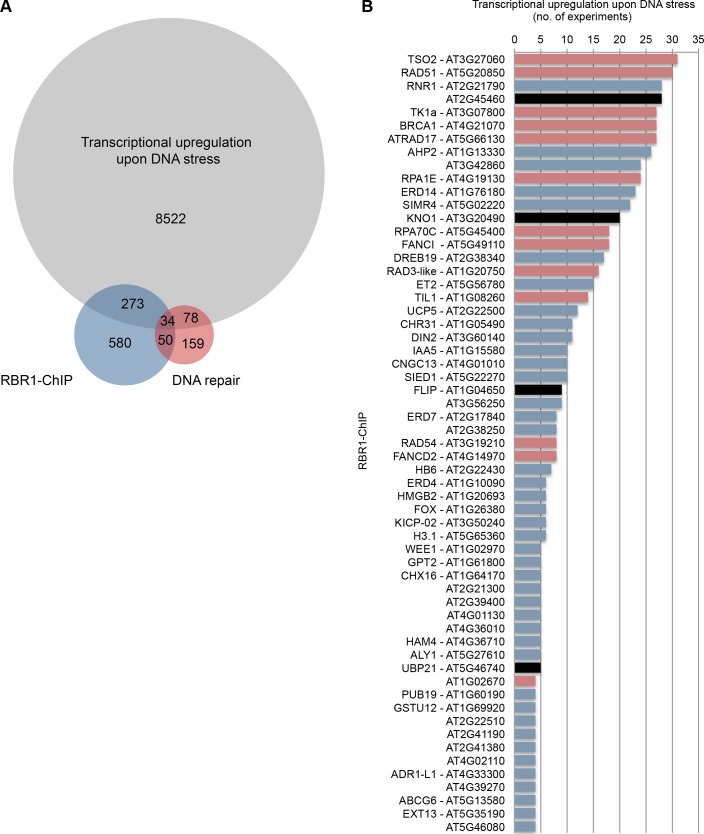
Fig 6. Meta-analysis of gene expression data from DNA stress experiments.
(A) VENN diagram displaying the number of genes upregulated at least once in 32 DNA-stress experiments (S5 Table) in comparison with RBR1-bound genes (S1 Table) and genes known to be involved in DNA repair (S4 Table). Highly significant enrichment (p < 0.0001, Fischer’s Exact test) of genes involved in DNA repair is seen when genes that are upregulated under DNA stress and bound by RBR1 (11.1% DNA repair genes) are compared with those that are upregulated but do not show RBR1 binding (0.9% DNA repair genes). (B) List of genes that are upregulated upon DNA stress in more than three out of 32 experiments and that are RBR1 targets according to the RBR1-ChIP experiment. The Y-axis displays the number of experiments in which a gene was found to be significantly upregulated under DNA-stress. For more detailed information, see S5 Table. Genes that are also present in the DNA-repair dataset (S4 Table) are labeled in red and the candidate genes for further investigation in black.

