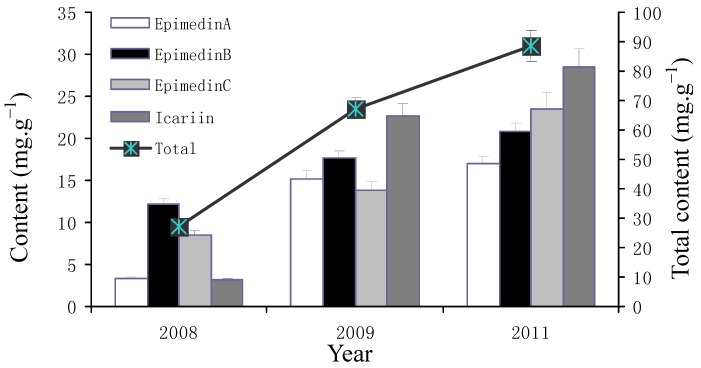
Figure 5.
Contents of the four flavonoids in LT race cultivated after one (2008), two (2009) and four years (2011). Values shown are mean for the three gardens (light intensity 50–180 μmol/m2/s). The two axes of coordinates represent the content of each flavonoid and the total of the four flavonoids (epimedin A, B, C, and icariin). Bars are standard errors.

