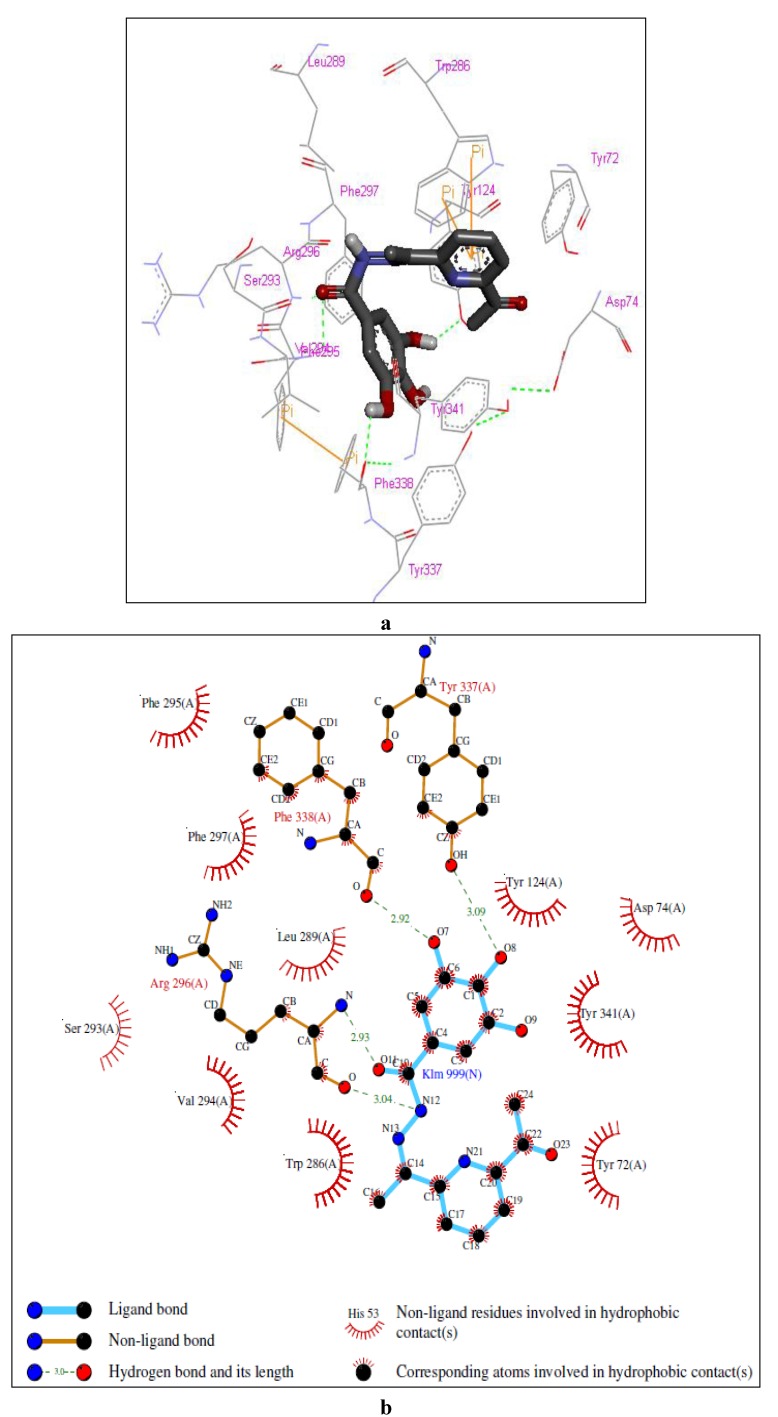
Figure 4.
Representations of the molecular model of the complex formed between compound 6 and hAChE. (a) 3D representation of the ligand-enzyme binding interactions. Compound 6 is represented as a dark grey sticks and hydrogen bonds as green dashed lines; (b) 2D schematic representation of the hydrogen bonding and hydrophobic interactions.

