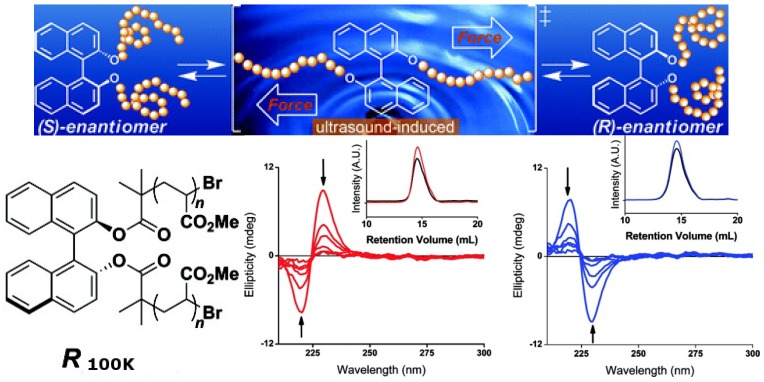
Figure 19.
Top: Mechanically facilitated reconfiguration processes of R100K and S100K. Bottom: CD spectra of CH3CN solutions of (red) S100K and (blue) R100K (0.1 mg/mL) as functions of time under the sonication. The arrows indicate the direction of the spectra as they changed over time. The insets show gel-permeation chromatograms of S100Kand R100Kbefore (red and blue, respectively) and after sonication (black) [91]. Reproduced by permission of the American Chemical Society.

