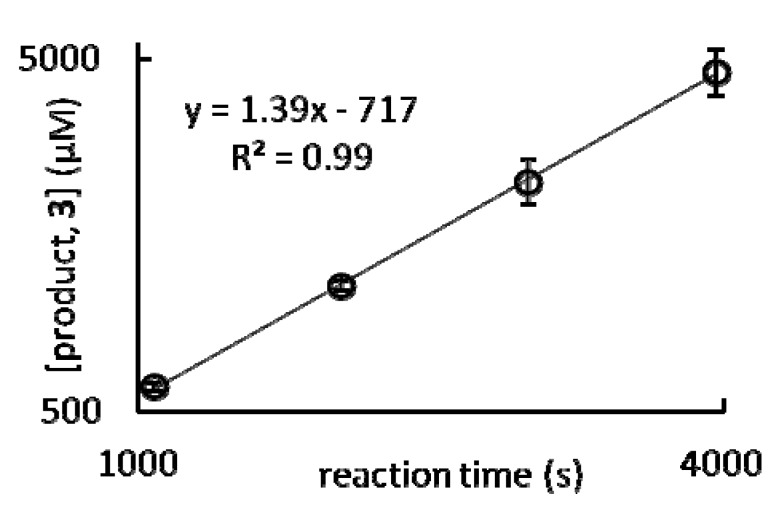
Figure 5.
Plot of the formation of product, 3, as a function of time. Conditions: 7 mol % Eu(OTf)3 in 10% H2O/THF (v/v) after 1080, 2040, 3000, and 3960 s. The steady state reaction rate derived from this plot is the slope of the best fit line and is 1.39 μM s–1. Error bars represent the standard error of the mean of three independently prepared samples.

