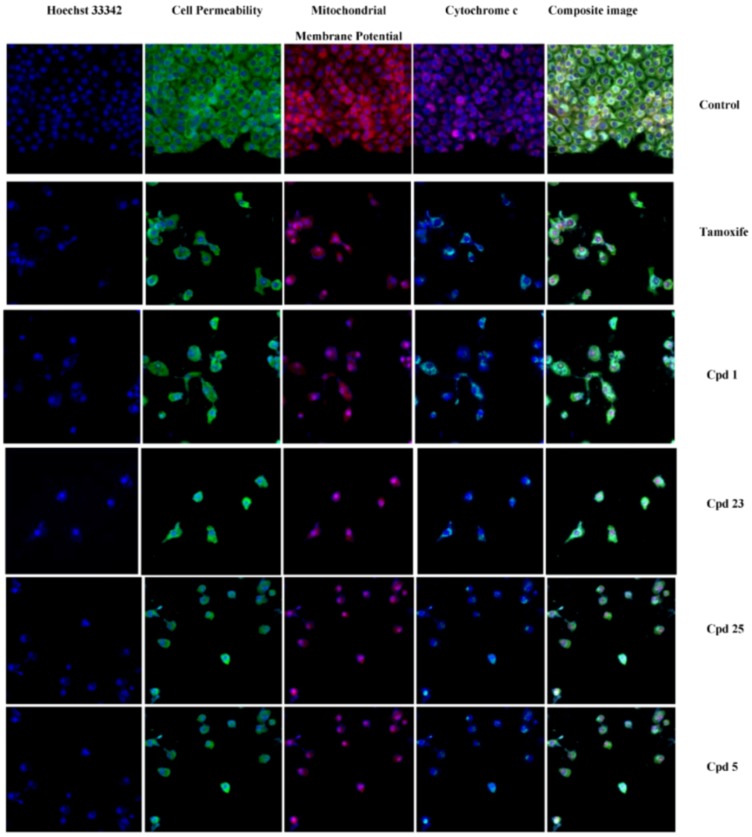
Figure 2.
Representative images of MCF7 cells treated with medium alone and compounds, and stained with nuclear staining dye, cell permeability dye, mitochondrial membrane potential dye and cytochrome c. The images from each row are obtained from the same field of the same treatment sample. MCF7 cells produced a marked reduction in mitochondrial membrane potential, and marked increases in membrane permeability and cytochrome c. (Magnification 20X). (1A- 3 µg/mL; 1B- 6 µg/mL), (23A- 3 µg/mL; 23B- 6 µg/mL), (25A- 2 µg/mL; 25B- 4 µg/mL) and (5A- 3 µg/mL; 5B- 6 µg/mL). The positive control used in the analysis was tamoxifen (0.04 µg/mL). “Cpd” refers to compound.

