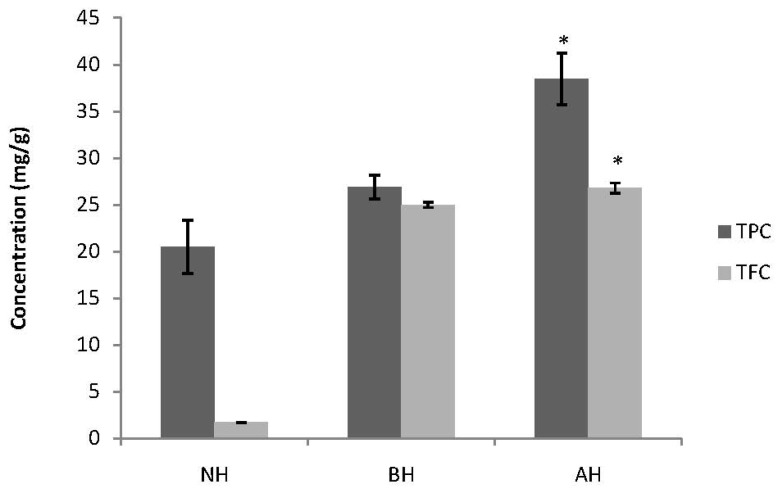
Figure 2.
Total phenolic content (TPC) and total flavonoid content (TFC) following acidic and basic catalyzed hydrolysis in germinated brown rice (GBR).
Each value in the diagram represent a mean ± SD (n = 3); * Indicates a significant difference between the three different media (p < 0.05). NH = No hydrolysis, BH = Basic hydrolysis, AH = Acidic hydrolysis. TPC was expressed in mg GAE/g d.w. of sample and TFC was expressed in mg RAE/g d.w. of sample.

