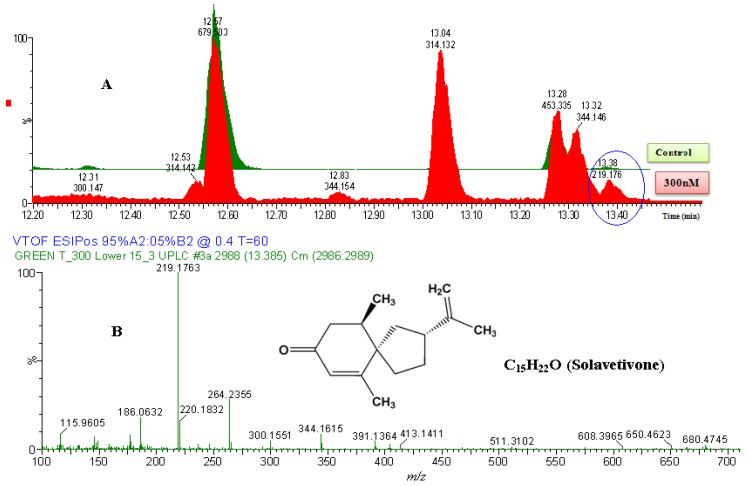
Figure 4.
The identification of solavetivone. (A) The zoomed-in ESI+-MS TICs comparing non-treated sample (green) and 300 nM-treated sample (red). The encircled ion peak is present only in the treated sample. (B) MS-spectrum of the encircled peak, eluted at 13.38 min (219.1763 Da). Based on the spectrum of the extracted ion peak, the empirical formula calculated (and selected) was C15H23O, with i-FIT of 0.0 and DBE of 4.5. Since the ion was generated by ESI+ mode, the calculated empirical formula would contain one proton (H+) extra. The corrected empirical formula is thus C15H22O; and searching in databases (structural correlation to MS spectrum), the compound was putatively identified as solavetivone (C15H22O, 218.340 Da).

