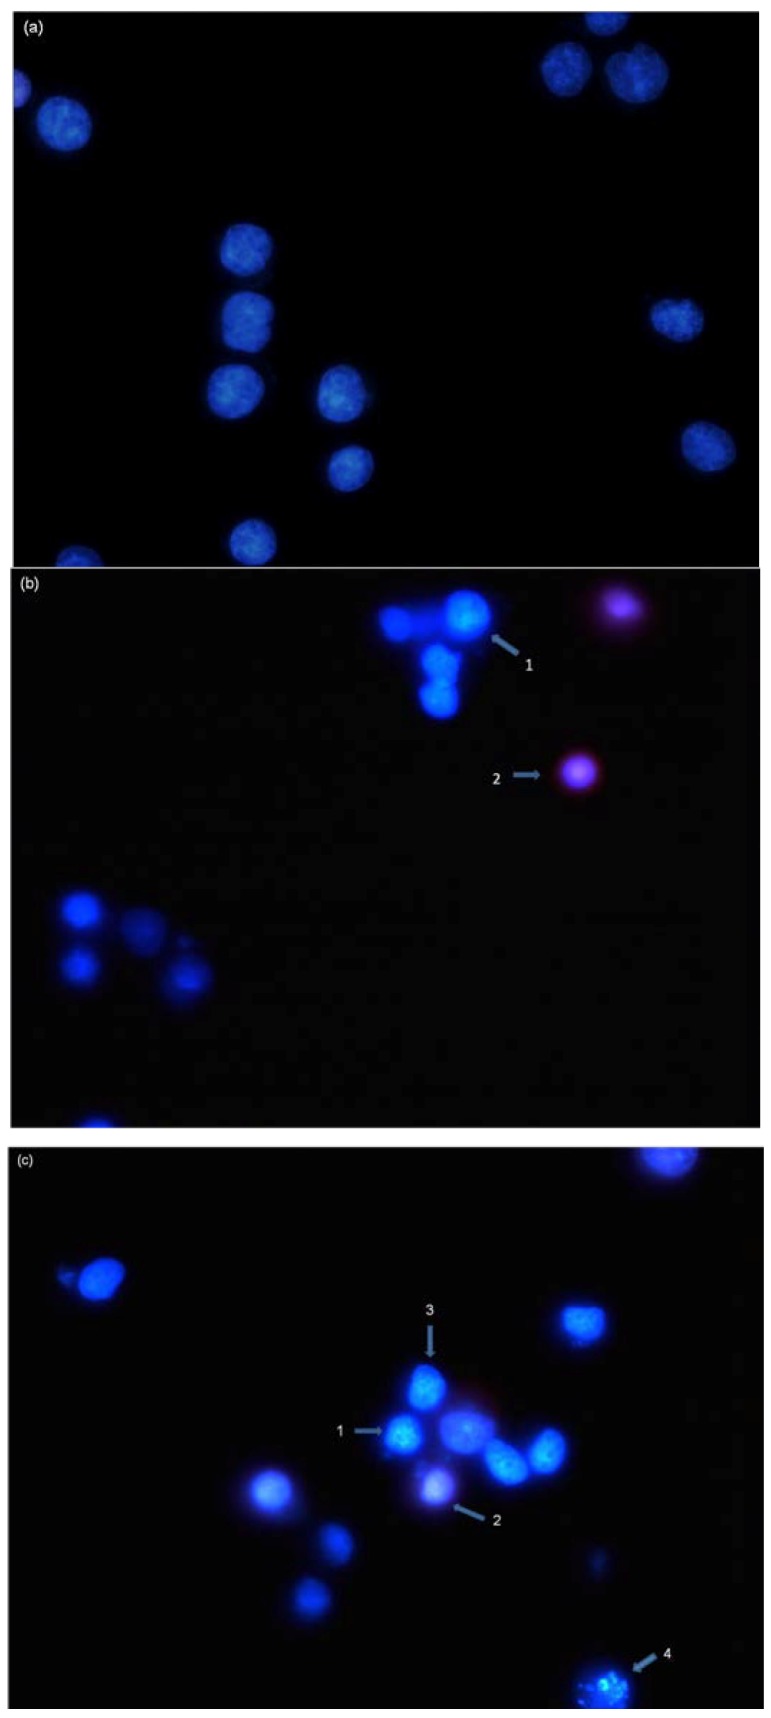
Figure 2.
Nuclear morphological changes of HT-29 cells by NRAF. (a) Untreated control cells. After exposure to 50 µg/mL of NRAF. (b) and 100 µg/mL of NRAF. (c) for 24 h, when stained with Hoechst 33342 and PI. Arrows indicated early (e.g., chromatin condensation, cell shrinkage and nuclear fragmentation) and late apoptotic morphological changes. Magnification: 630×. Arrow 1 indicates chromatin condensation, 2 late apoptosis, 3 cell shrinkage, 4 DNA fragmentation.

