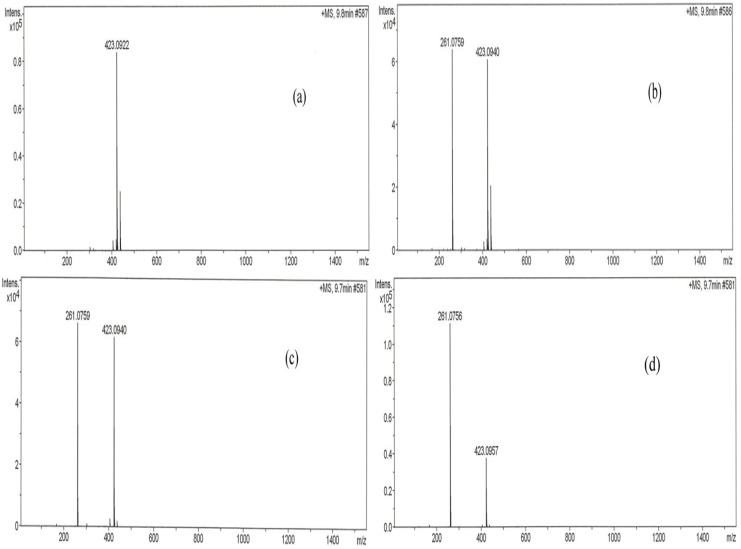
Figure 9.
LC chromatogram of (a) standard mangiferin, (b) methanol extract, (c) n-butanol fraction and (d) sub-fraction I of P. macrocarpa. The analysis was performed on a HyStar LC model using an Acclaim Polar Advantage II 3 μm C18 column (2.1 × 150 mm). The mobile phase used consisted of (A) water-formic acid (99.9:0.1 v/v) and (B) CH3CN. The injection volume of each sample (1 mg/mL) was 20 μL. The flow rate of the mobile phase was set at 0.2 mL/min and peaks monitored at 340 nm.

