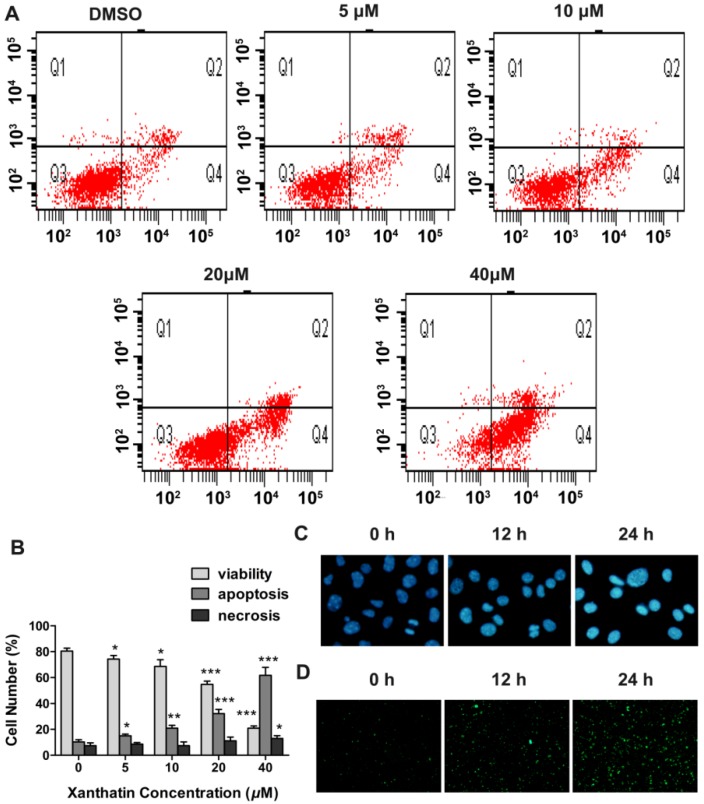
Figure 4.
Xanthatin induced apoptosis in A549 cells. (A) Flow cytometric analysis of annexin V-FITC/PI double-staining in A549 cells treated with xanthatin at indicated concentrations for 24 h; (B) The percentages of cells within each of the cell stage in A549 cells treated with xanthatin at indicated concentrations for 24 h; (C) Cell morphology under fluorescence microscopy by Hoechst 33258 staining in A549 cells treated with xanthatin (20 μM) for indicated time (×400); (D) Cell morphology under fluorescence microscopy by Annexin V-FITC staining in A549 cells treated with xanthatin (20 μM) for indicated time (×100). Data were presented as means ± SD by three independent experiments. Significance: * p < 0.05 versus the control; ** p < 0.01 versus the control, *** p < 0.001 versus the control.

