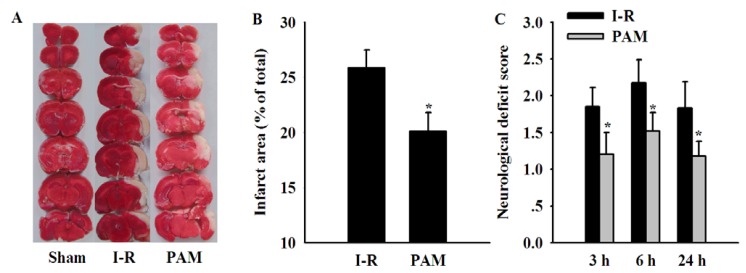
Figure 5.
Effects of PAM 10 mg/kg on cerebral infarct area and neurological deficit score. (A) Representative images of coronal brain sections stained with TTC; (B) Quantitative analysis of infarct area (C) Quantitative analysis of neurological deficits score at reperfusion 3 h, 6 h, 24 h, respectively. Data are mean ± SD, n = 8 in each group. The infarct area results were compared using Student’s t-test. Neurological deficit scores were analyzed by Kruskal–Wallis test followed by the Dunn test (multiple comparisons). * P < 0.05 vs. I-R group.

