Figure 5.

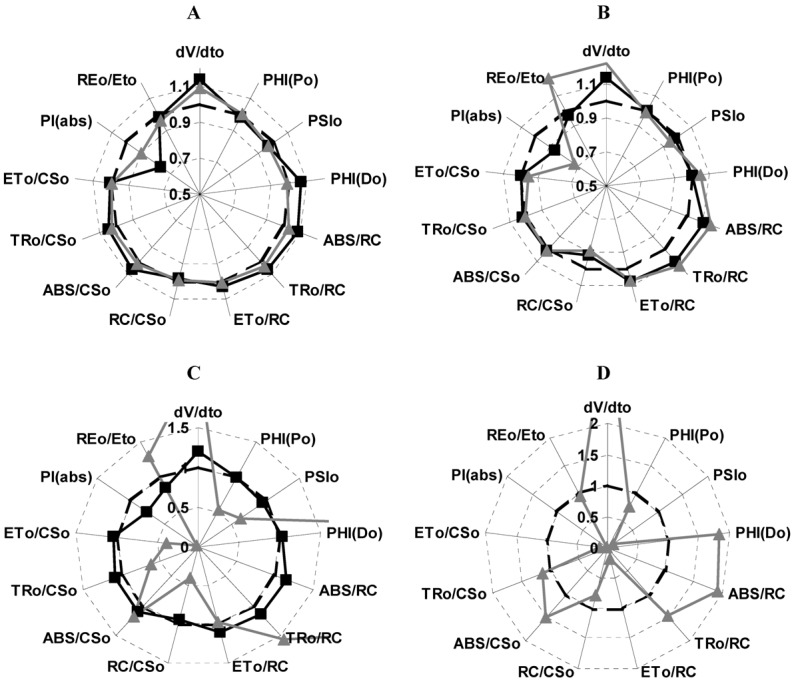
Effect of 1 at 50 (■) and 100 µg/mL (▲) on different calculated parameters from OJIP curves measured on P. ixocarapa plants treated after 24 h (Panel A), 48 h (Panel B) and 72 h (Panel C), and 50 µM DCMU (Panel D) after 72 h of treatment.

Effect of 1 at 50 (■) and 100 µg/mL (▲) on different calculated parameters from OJIP curves measured on P. ixocarapa plants treated after 24 h (Panel A), 48 h (Panel B) and 72 h (Panel C), and 50 µM DCMU (Panel D) after 72 h of treatment.