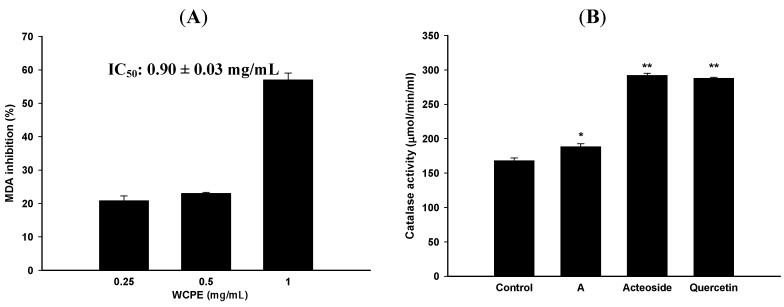
Figure 3.
MDA inhibitory effects (A) and catalsed activity (B) of WCPE and marker substances. A, WCPE; Control, untreated group. Concentrations of WCPE and marker substances in catalase assay were 10 mg/mL and 5 μM, respectively. * p < 0.05, ** p < 0.005, compared to the control group. Statistical significant differences were determined by One-Way ANOVA followed by a Fisher LSD post hoc test.

