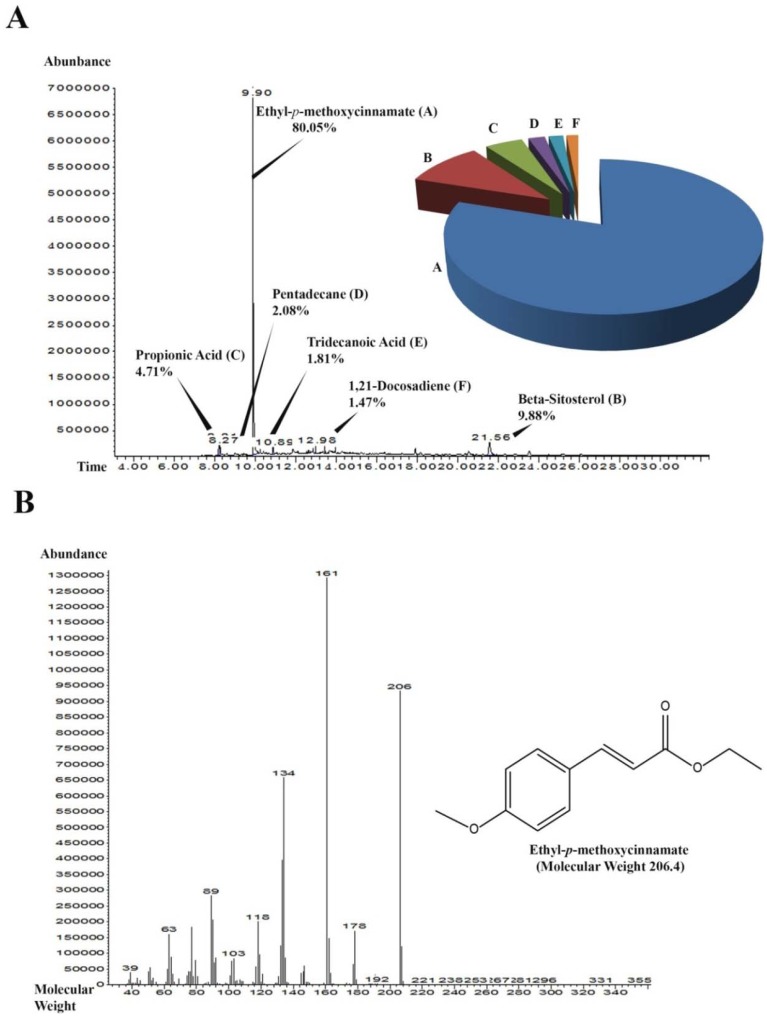
Figure 4.
GC-MS chromatogram of the most effective sub-fraction (SF-1). (A) Peaks of the components detected in sub-fraction 1 along with their retention time. The pie chart represents the relative percentage abundance of each constituent detected. (B) Fragmentation of the most abundant peak with retention time 9.90. The most abundant compound was ethyl-p-methoxycinnamate (EPMC) with estimated molecular weight of 206.4.

