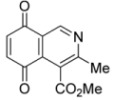
Table 2.
Cytotoxic activity of 1 and their aminoisoquinoline-5,8-quinone derivatives.
| IC50 ± SEM a (μM) | ||||||
|---|---|---|---|---|---|---|
| N° | Structure | MRC-5 b | AGS c | SK-MES1 d | J82 e | HL-60 f |
| 1 |  |
4.5 ± 0.3 | 17.34 ± 1.64 | 25.9 ± 1.6 | 14.81 ± 0.74 | 14.81 ± 0.74 |
| 2a |  |
8.1 ± 0.3 | 3.5 ± 0.2 | 5.22 ± 0.38 | 5.1 ± 0.4 | 9.74 ± 0.76 |
| 3a |  |
7.9 ± 0.3 | 2.3 ± 0.1 | 5.99 ± 0.36 | 7.2 ± 0.4 | 6.16 ± 0.36 |
| 4a |  |
10.1 ± 0.6 | 4.0 ± 0.2 | 5.33 ± 0.26 | 12.0 ± 1.0 | 10.67 ± 0.64 |
| 4b |  |
2.2 ± 0.1 | 0.59 ± 0.03 | 1.69 ± 0.09 | 3.0 ± 0.2 | 1.57 ± 0.13 |
| 5a |  |
6.7 ± 0.4 | 1.75 ± 0.09 | 4.00 ± 0.22 | 8.56 ± 0.27 | 2.99 ± 0.15 |
| 5b |  |
3.77 ± 0.21 | 1.20 ± 0.06 | 1.76 ± 0.11 | 2.99 ± 0.12 | 2.11 ± 0.13 |
| 6 |  |
2.6 ± 0.2 | 1.8 ± 0.1 | 1.66 ± 0.08 | 2.0 ± 0.1 | 2.64 ± 0.21 |
| 7 |  |
1.9 ± 0.2 | 1.9 ± 0.0 | 1.15 ± 0.05 | 1.2 ± 0.1 | 2.63 ± 0.13 |
| 8 |  |
2.7 ± 0.2 | 1.1 ± 0.0 | 2.13 ± 0.13 | 2.2 ± 0.2 | 3.57 ± 0.16 |
| 9 |  |
7.1 ± 0.5 | 2.6 ± 0.2 | 1.29 ± 0.08 | 1.2 ± 0.1 | 2.34 ± 0.14 |
| 10 |  |
2.2 ± 0.2 | 0.56 ± 0.03 | 2.14 ± 0.13 | 2.3 ± 0.1 | 2.15 ± 0.12 |
| 11 |  |
9.53 ± 0.38 | 8.15 ± 0.49 | 1.46 ± 0.06 | 6.97 ± 0.35 | 2.61 ± 0.18 |
| 12 |  |
1.8 ± 0.1 | 1.2 ± 0.1 | 0.93 ± 0.03 | 1.1 ± 0.1 | 2.16 ± 0.09 |
| 13 |  |
0.28 ± 0.01 | 0.26 ± 0.01 | 0.21 ± 0.01 | 0.29 ± 0.01 | 0.49 ± 0.02 |
| Etoposide | 0.33 ± 0.02 | 0.58 ± 0.02 | 1.83 ± 0.09 | 3.49 ± 0.16 | 2.23 ± 0.09 | |
a Data represent mean average values for six independent determinations; b Normal human lung fibroblasts cells; cHuman gastric adenocarcinoma cell line; d Human lung cancer cell line; e Human bladder carcinoma cell line; f Leukemia cell line.
