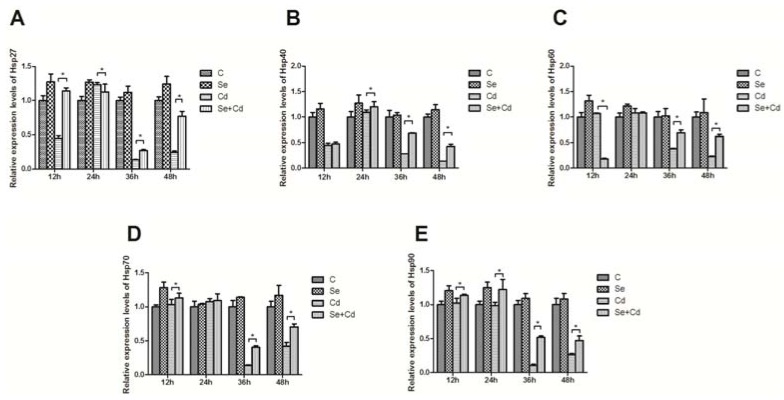
Figure 1.
Effects of Se on Cd-induced changes in the mRNA levels of HSP. Panels A–E represent the effects of Se on Cd-induced changes in the mRNA levels of HSP27, HSP40, HSP60, HSP70, HSP90, respectively. The relative mRNA levels from the C groups were used as the reference values, the * with connecting lines indicated that there were significant differences (p < 0.05) between any two groups. Each value represented the mean ± SD of 5 individuals.

