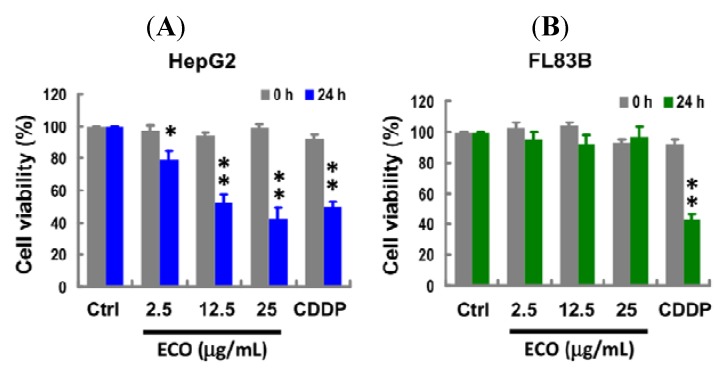
Figure 1.
Effect of ECO on cell viability in HepG2 and FL83B cells. HepG2 cells (A) and FL83B cells (B) were treated with ECO at different concentrations for 24 h. Cell viability measured by the MTT assay was normalized to the control cells and data were represented as the mean ± SD. * p < 0.05 and ** p < 0.01 as compared to the control. Cells treated with CDDP at a concentration of 7.5 μg/mL were used as the positive control for the induction of cell death.

