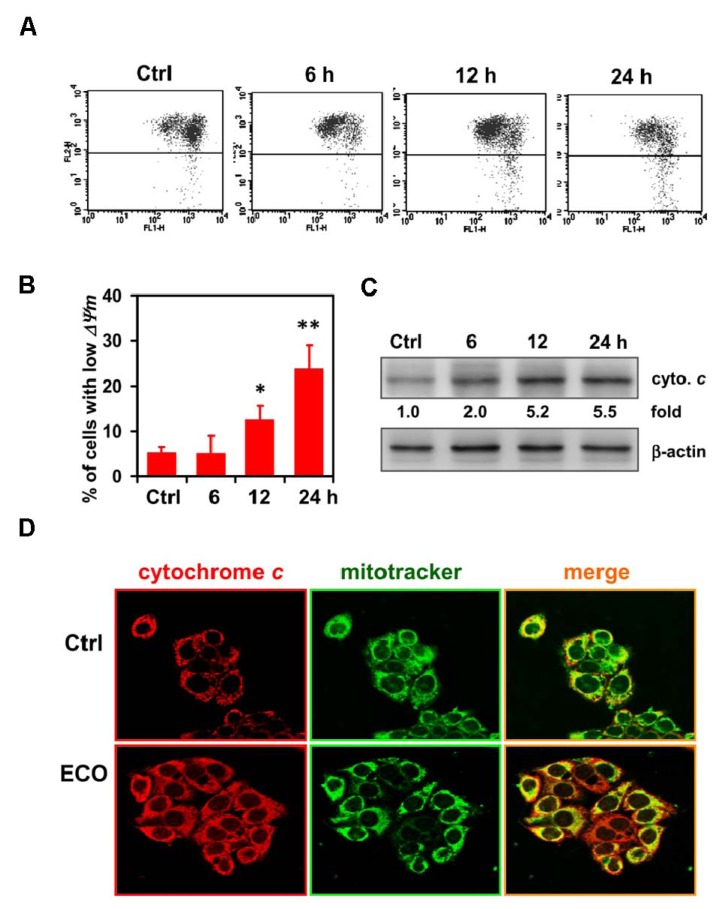
Figure 4.
ECO-induced loss of mitochondrial membrane potential and the release of cytochrome c. (A) Mitochondrial membrane potential in ECO-treated HepG2 cells evaluated by JC-1 staining and flow cytometry analysis. JC-1 was used to trace the alteration of mitochondrial membrane potential. Representative FL1/FL2 profiles with green/red fluorescence are shown in ECO-treated HepG2 cells with concentration of 12.5 μg/mL. (B) Quantification of the JC-1 level with high green emission in the cells treated with ECO as shown in (A). Data were represented by mean ± SD. (C) Localization of cytochrome c in ECO-treated HepG2 cells. Cells were treated with ECO for 24 h, and the subcellular distribution of cytochrome c (stained by red fluorescence) was examined by immunostaining. MitoTracker (stained by green fluorescence) was used as a mitochondrial marker (original magnification, ×630).

