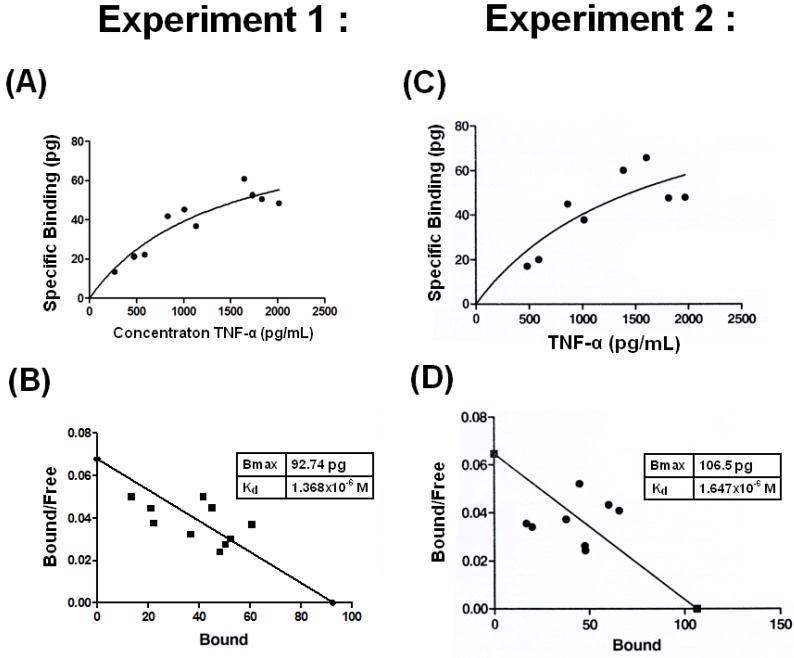
Figure 3.
Binding affinity of THP for TNF-α was conducted in two independent experiments by ELISA. (A) and (C): The specific binding vs. TNF-α concentrations are plotted. (B) and (D): Y transformed curves are derived from the specific bindings of the two experiments. Bmax and Kd values were then calculated by Scatchard plot analysis as described in Materials and Methods in Section 3.6.

