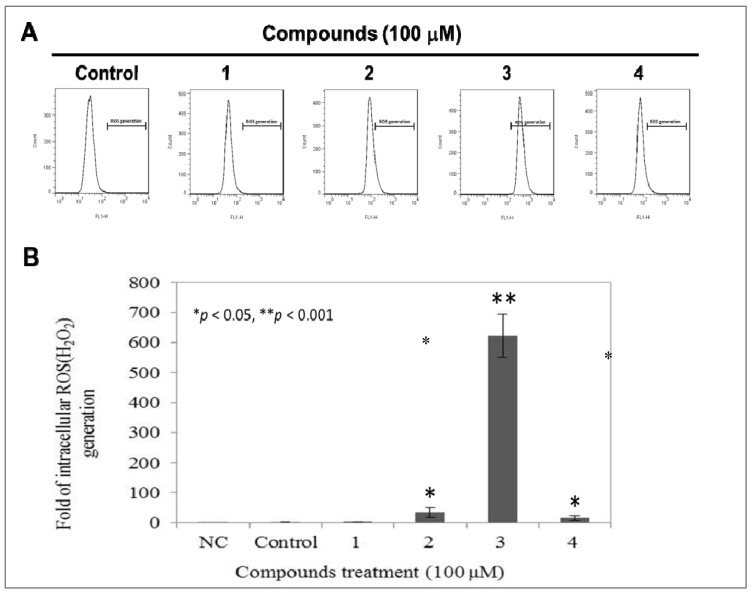
Figure 5.
Modulations of endogenous ROS in A375.S2 cells by L. tulipifera compounds. 1 × 10⁵ of A375.S2 cells were seeded onto a 6-well plate and treated with or without 100 μM of 1–4 for 12 h, respectively. (A) The level of endogenous ROS was determined by DCFDA staining combined with a flow cytometry analysis. NC, Negative control, Unstained cells; Control, cells treated with vehicle. (B) Quantitative analysis. * p < 0.05 and ** p < 0.001 against vehicle control, respectively.

