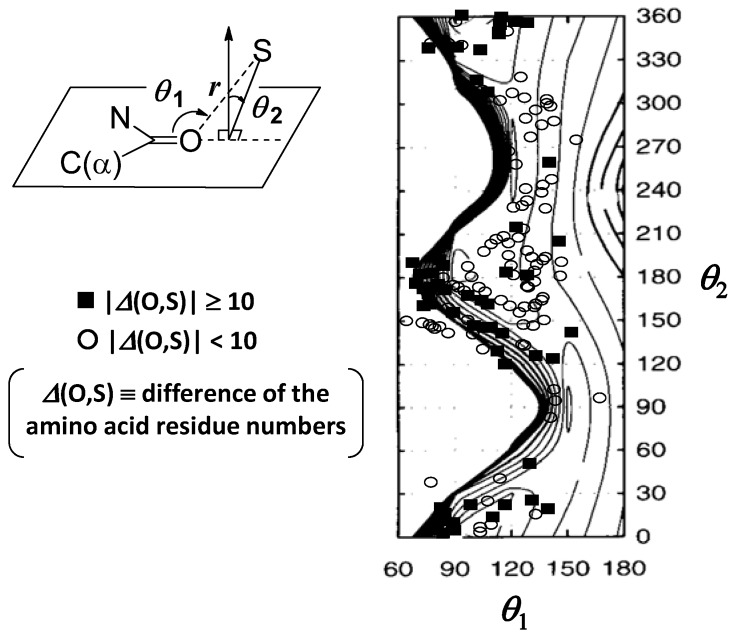
Figure 6.
The directionality around the O atom in the S–S···O=C interactions in proteins superimposed on the potential surface calculated for the complex of between CH3SSCH3 and CH3CONHCH3 at MP2/6-31G(d). The contour lines are drawn with an interval of 0.25 kcal/mol. This figure was modified from reference [18].

