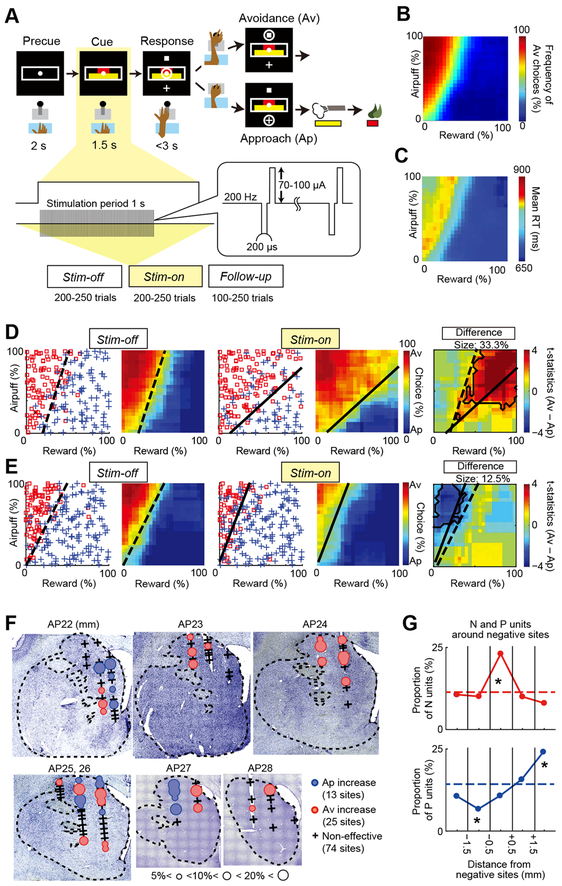
Figure 1. The Ap-Av Task and the CN Microstimulation Effects.
(A) Task procedure and experimental blocks. During the cue period, the red and yellow horizontal bars, respectively signaling the offered amounts of reward and punishment, appeared on the monitor. The monkeys made a decision between acceptance and rejection of the combined offer, and reported this by choosing either of two targets (cross for acceptance; square for rejection) that appeared during the response period. The locations of the targets were alternated randomly.
(B) Mean Ap-Av choices.
(C) Mean reaction times.(D and E) Examples of negative
(D) and positive (E) stimulation effects. Ap (blue cross) and Av (red square) choices in the Stim-off (left panels) and Stim-on (middle panels) blocks in the same session and difference between these blocks (right panels). Decision matrices are plotted in left panels for the two blocks. Black contours in the right panels represent significant effect zones (p < 0.05, Fisher’s exact test). Dashed and solid lines in these panels respectively denote the decision boundaries in the Stim-off and Stim-on blocks.
(F) Distribution of the effective sites. Stimulation results mapped onto Nissl-stained coronal sections. Blue and red circles indicate sites at which microstimulation respectively induced an increase in Ap and Av. Black crosses indicate non-effective sites. The size of the circles indicates the size of the effects. Data from monkey S were projected onto those from monkey P.
(G) Proportions of N units (top) and P units (bottom) (number of N and P units / total number of recorded units), shown for 1-mm bins around the negative effective sites. Asterisk indicates the bin in which the proportion of N units or P units was significantly different from that of units aggregated over all tracks. *p < 0.05 (Fisher’s exact test).
See also Figure S1.

