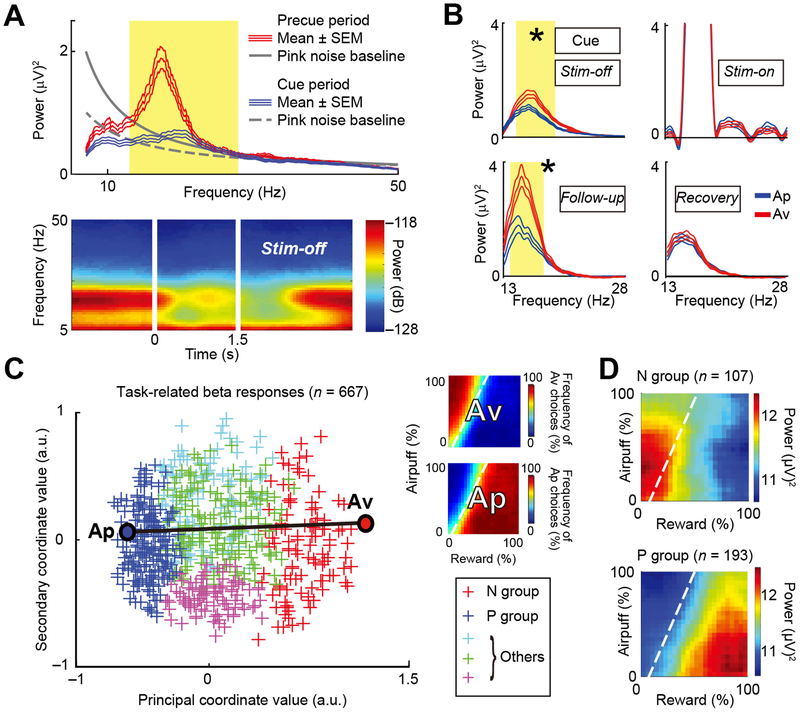
Figure 5. Beta Oscillations Represent Decision-Related Variables.
(A) Example of power spectrum (top) and spectrogram (bottom) of task-related LFP activity. Red and blue lines in the top panel indicate the mean spectra (± SEM) for, respectively, the precue and cue periods. Yellow shading indicates the beta range (13–28 Hz). The gray line (solid: precue, dashed: cue) indicates the fitted pink noise baselines.
(B) Example of baseline-subtracted power spectra (± SEM) of the cue-period LFP activity that exhibited choice selectivity modulation during a negative effective session. Red and blue lines indicate the mean spectra (± SEM) for upcoming Av (red) and Ap (blue) choices, respectively. For each block, z-tests were performed between spectra for Ap and Av. Yellow shading indicates the frequency range with significant differences between Ap and Av in the power spectra. *p < 0.05 (z-test, Bonferroni corrected).
(C) Beta response matrices projected onto the first two dimensions of the MDS (MDS map). Each cross indicates individual channel. Color indicates the group to which the channel belongs (N group: red; P group: blue; and other groups: green, cyan and magenta). To examine the similarity of each beta response to the behavioral choice pattern, MDS was performed with the Ap and Av behavioral responses shown on the right. The position of behavioral Ap choice (top right matrix) was at the leftmost position, and that of Av choice (bottom right matrix) at the rightmost position in the MDS map, indicating that the principal coordinate value (i.e., PCV) represents Av-Ap tuning of each beta response.
(D) Mean beta responses of N (top) and P (bottom) groups plotted in decision matrices. Dashed lines: decision boundaries.
See also Figure S7.

