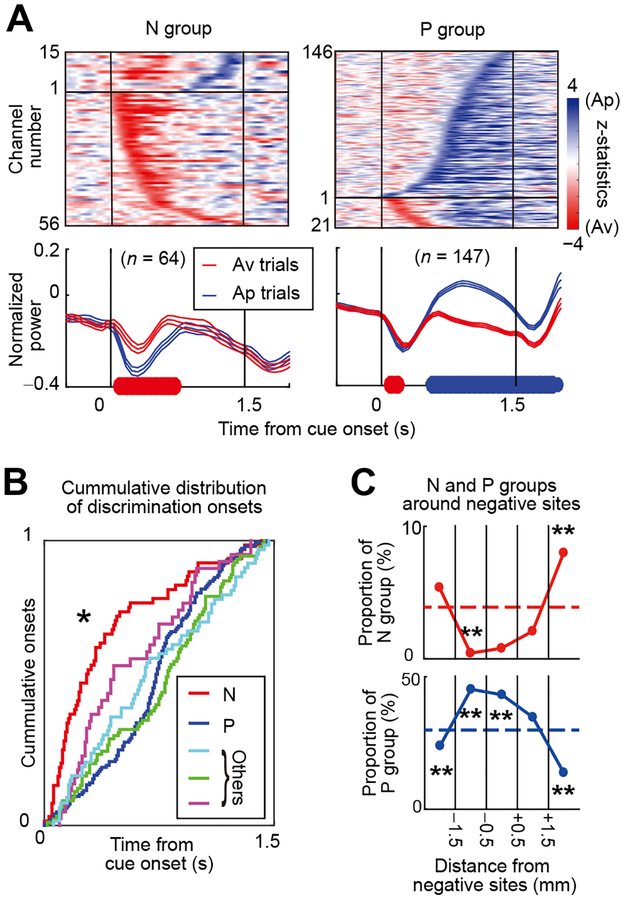
Figure 6. Properties of the Beta Responses That Belong to N and P Groups.
(A) Time-course of the z-values (top, Wilcoxon rank-sum test) and power (bottom, mean ± SEM normalized by precue activity) of beta responses that discriminated upcoming Av (red) and Ap (blue) choices and that were categorized as N (left) or P (right) groups. Colored highlights on x-axis show significantly larger magnitudes for Av (red) or Ap (blue) choice (p < 0.05, two-tailed t-test).
(B) Cumulative onset times at which beta responses discriminated upcoming choices, showing significantly earlier onset in N group (red) than in the others. *p < 0.05 (Kolmogorov-Smirnov test).
(C) Proportions of N-group (top) and P-group (bottom) beta responses (number of beta in each group / total number of recorded beta), shown for 1-mm bins around the negative effective sites. Asterisk indicates the bin in which the proportion of N-group or P-group beta response was significantly different from that of beta responses aggregated over all tracks. **p < 0.01 (Fisher’s exact test).
See also Figure S7.

