
Figure 2:
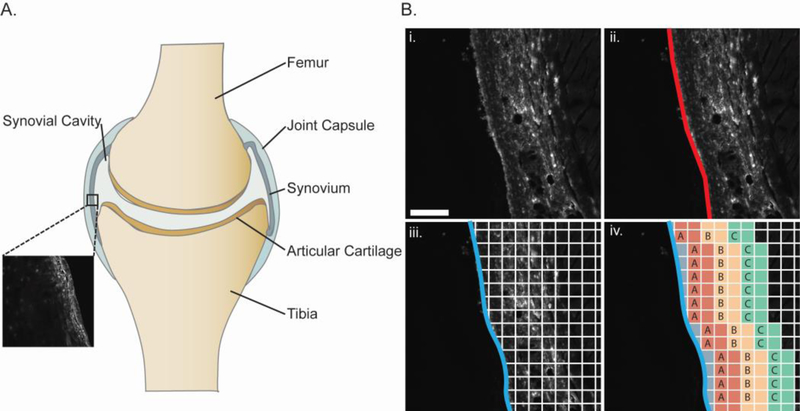
A. Representative schematic describing basic anatomy of a diarthrodial joint; the inset image depicts the synovial tissue that was analyzed in the adjacent panel B. (i) Representative image of synovial tissue section after scaling to 16-bit greyscale (scale bar = 100 μm) showing method used to calculate trans-synovial transport of fluorescently-labeled dextrans. (ii) Synovial boundary manually marked (red) was fit to a cubic spline (iii) and tissue depths were gridded and pixel intensity values obtained at grid points along each horizontal profile. (iv) Profiles were split into discrete bins by depth and assigned to grouped bins.