Figure 4:

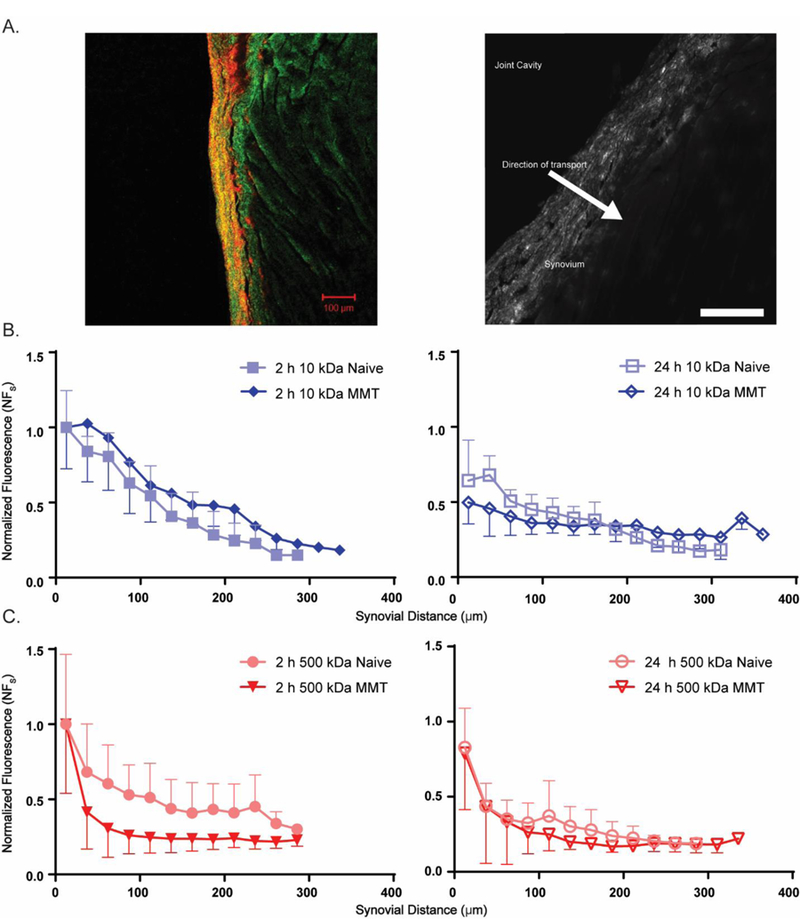
A. Fluorescence micrograph (Left) of rat synovium with 543 nm excitation (red, Texas red) and 488 nm excitation of muscle autofluorescence (green). Greyscale image (Right) showing trans-synovial transport of fluorescently-labeled dextrans. Bright fluorescence was typically observed at the synovial intima (most superficial part of the synovium) with decreasing fluorescence in the direction of transport towards the sub-synovium (scale bar = 100 μm). B. NFs values for 10 kDa dextran transport across naive and MMT joint synovium following intra-articular injection. Decreasing NFs is observed with distance from the synovial intima. C. NFs values for 500 kDa dextran transport across joint synovium as described above. An exponential profile is observed with decreasing NFs with distance from the synovium surface. The fluorescence profile for the 500 kDa dextran measured at 2h post-injection differed from that at 24h post-injection, for the naïve joints only (ANCOVA, p< 0.0001, not shown). The fluorescence profile did not differ with time for 10 kDa dextrans in any joint, nor for 500 kDa dextrans in the MMT joints. Data represent mean ± SD.
